Calculating
port call costs
Turning a paper-and-spreadsheet business into a quoting system
Organising ships in port is still run on paper and, occasionally, spreadsheets — an archaic, ancient business. Inchcape wanted to digitise it, and the pressing reason was money: large customers disputed paper invoices for months on end, and nobody could reliably say what was owed or where a dispute had got to.
The shipped job screen — disbursement accounts, funding and services in one auditable place.
Understanding the business need
Inchcape staff spent the majority of their time calculating port call costs. There are thousands of in-port services, and the price of each one varies on factors like time of day and vessel draft. Every quote was assembled by hand from tariff documents.
The pressure to get a quote out quickly enough to stay competitive produced long hours, high stress and real inefficiency for the business. And because the paperwork was the only record, invoices could be disputed for a very long time — sometimes until Inchcape dropped the customer.
Quotes were slow to produce and impossible to audit, so debts owed to Inchcape were slow to collect.
Digitising the calculation wasn't a tidying exercise. It was the only way to give every line of a quote a traceable origin — and therefore to make an invoice hard to argue with.
User research
Inchcape's local port agents take enquiries from customers looking to bring a vessel into port, and have to create a quote as quickly as possible. I went to the people doing it and mapped where the time actually goes.
The race isn't to price a call accurately. It's to price it accurately before a competitor prices it at all.
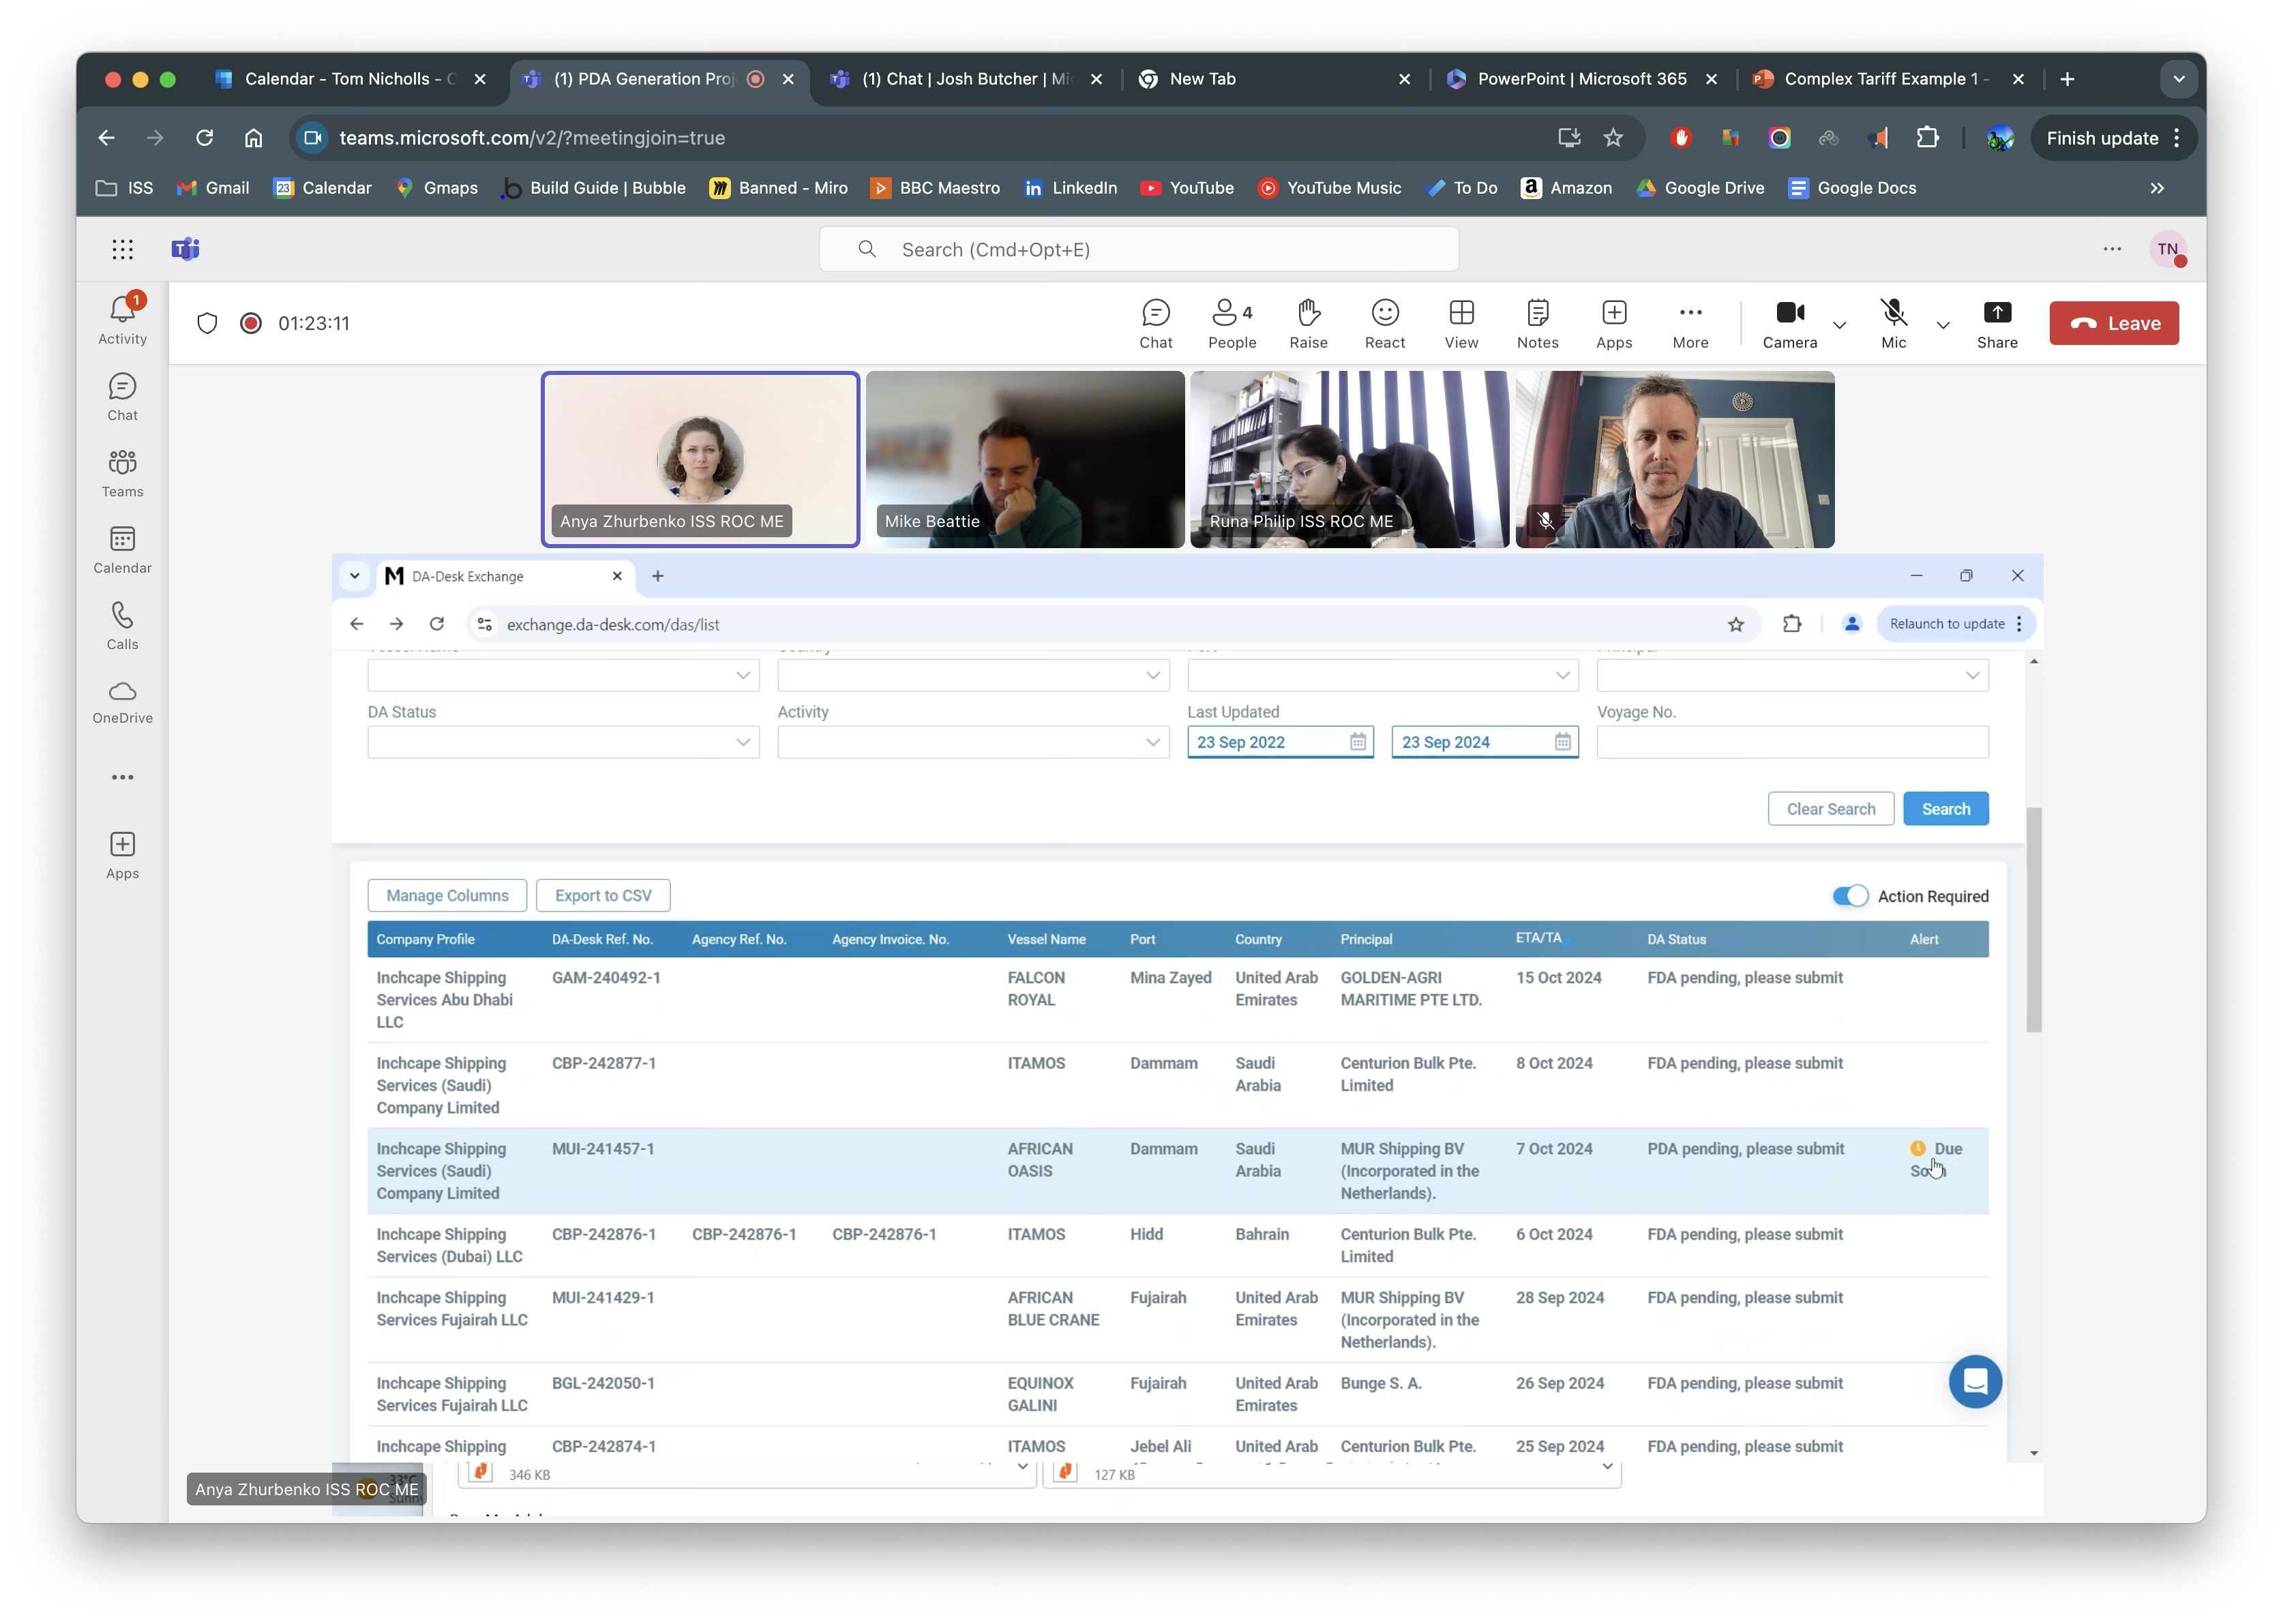
A focus group with port managers — walking through the tools they use today to find what a new system actually had to do.
Solution ideation
We ran an in-depth feasibility study against the alternatives, and concluded it would be advantageous to build our own system rather than bend an existing product around a pricing model this specific.
Nothing off the shelf could hold thousands of port services, each with their own variables, and still be editable by the people who own the tariffs locally.
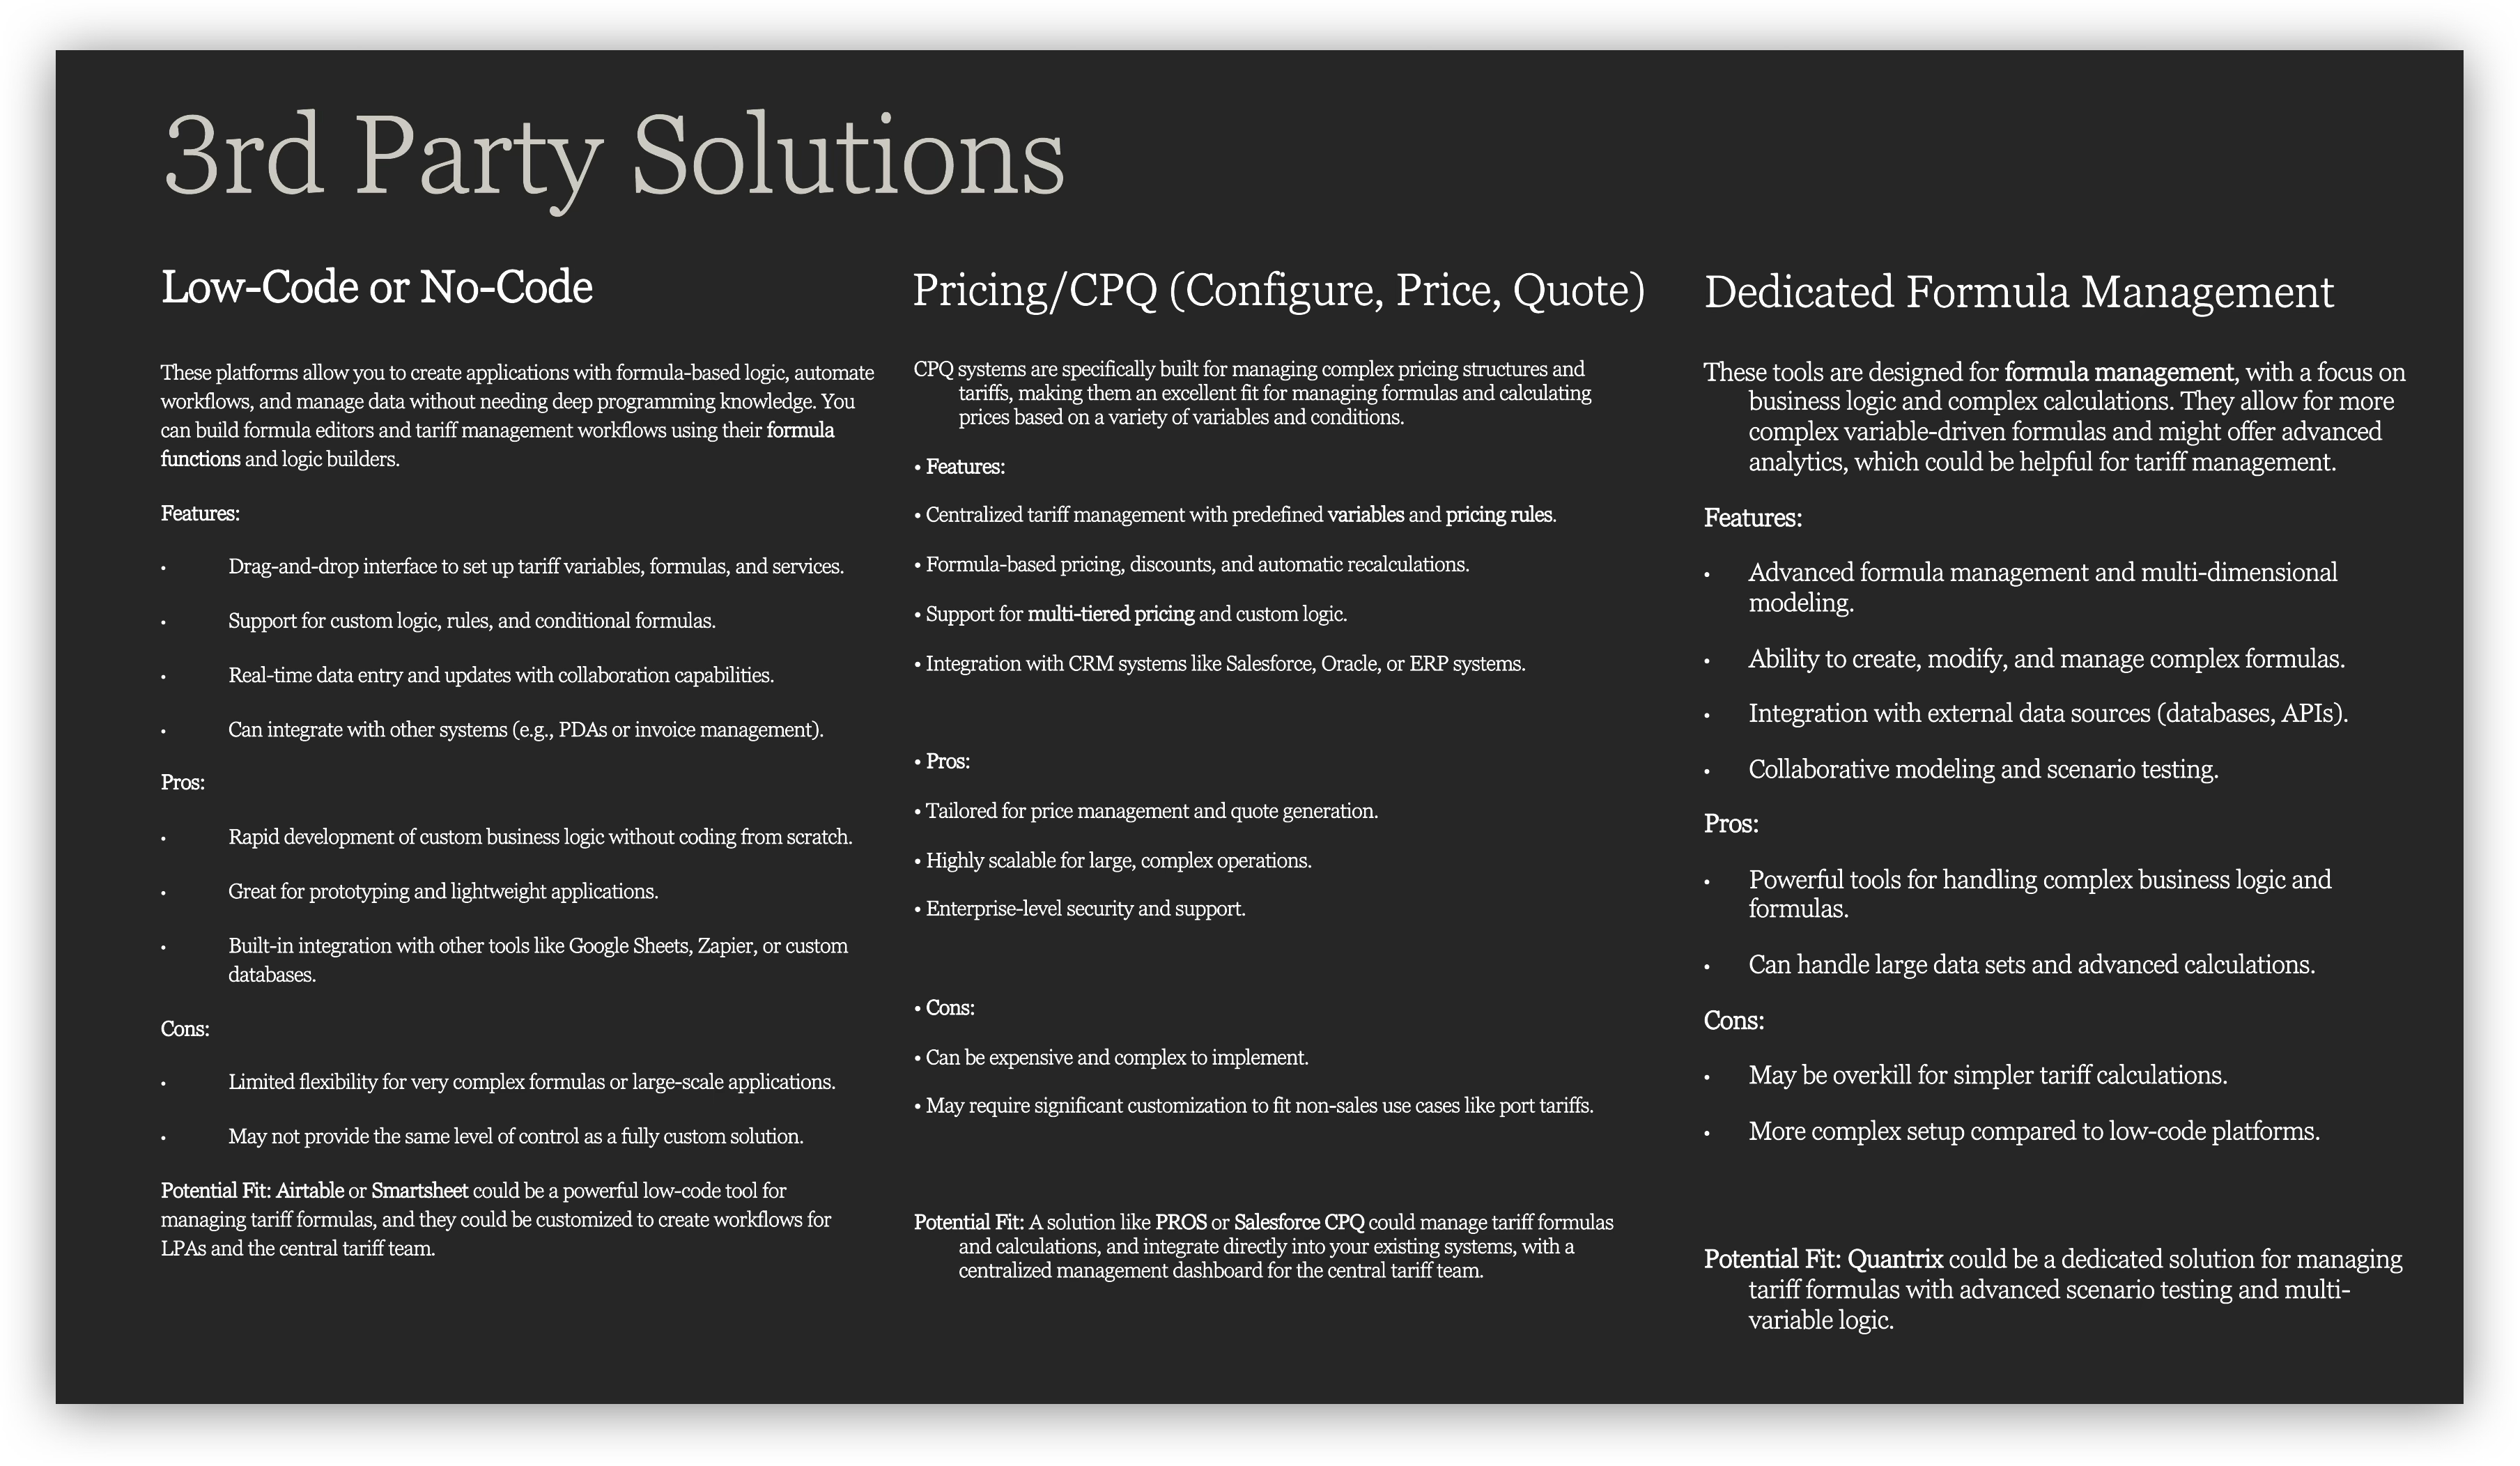
The third-party assessment — each category weighed on features, pros, cons and fit before we committed to building.
Mapping the experience, then the pricing
First the end-to-end experience of a port call, so everyone could see where a quote sits in it. Then the harder half: an in-depth discovery into how the existing workflow and pricing structure actually work.
We took in documentation from all over the world — the tariffs for ports, services and vendors, the pricing structures, and the variables such as time of day that change a figure. No two regions documented it the same way.
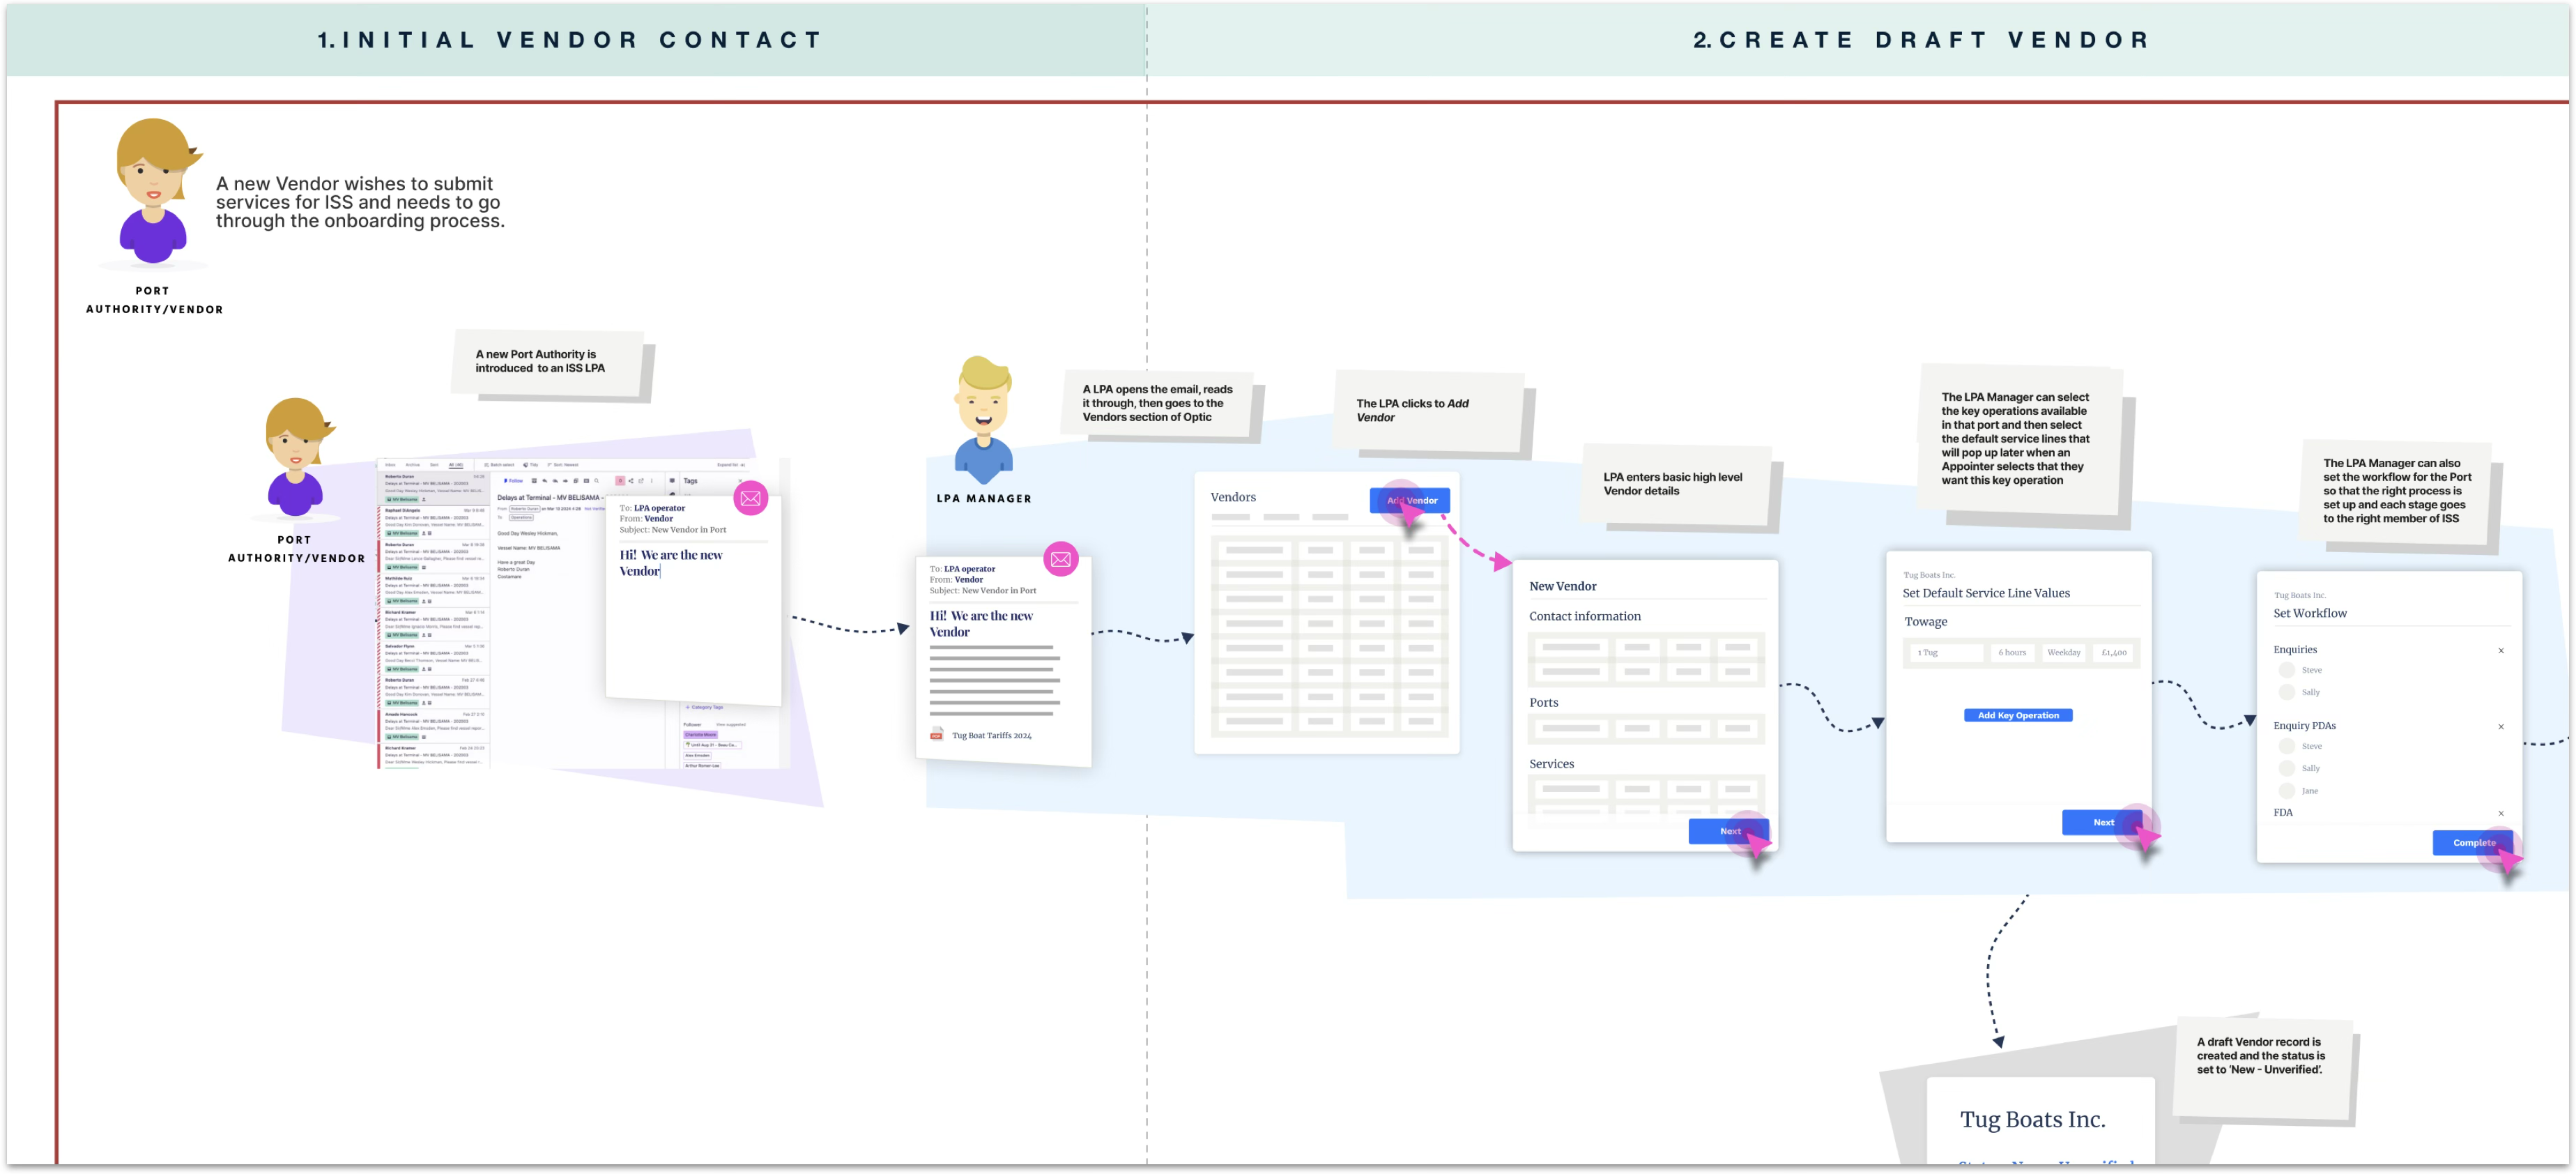
The as-is experience, mapped stage by stage — here the vendor onboarding run, from a first email to a draft vendor record marked ‘New – Unverified’. Scroll to follow it across.
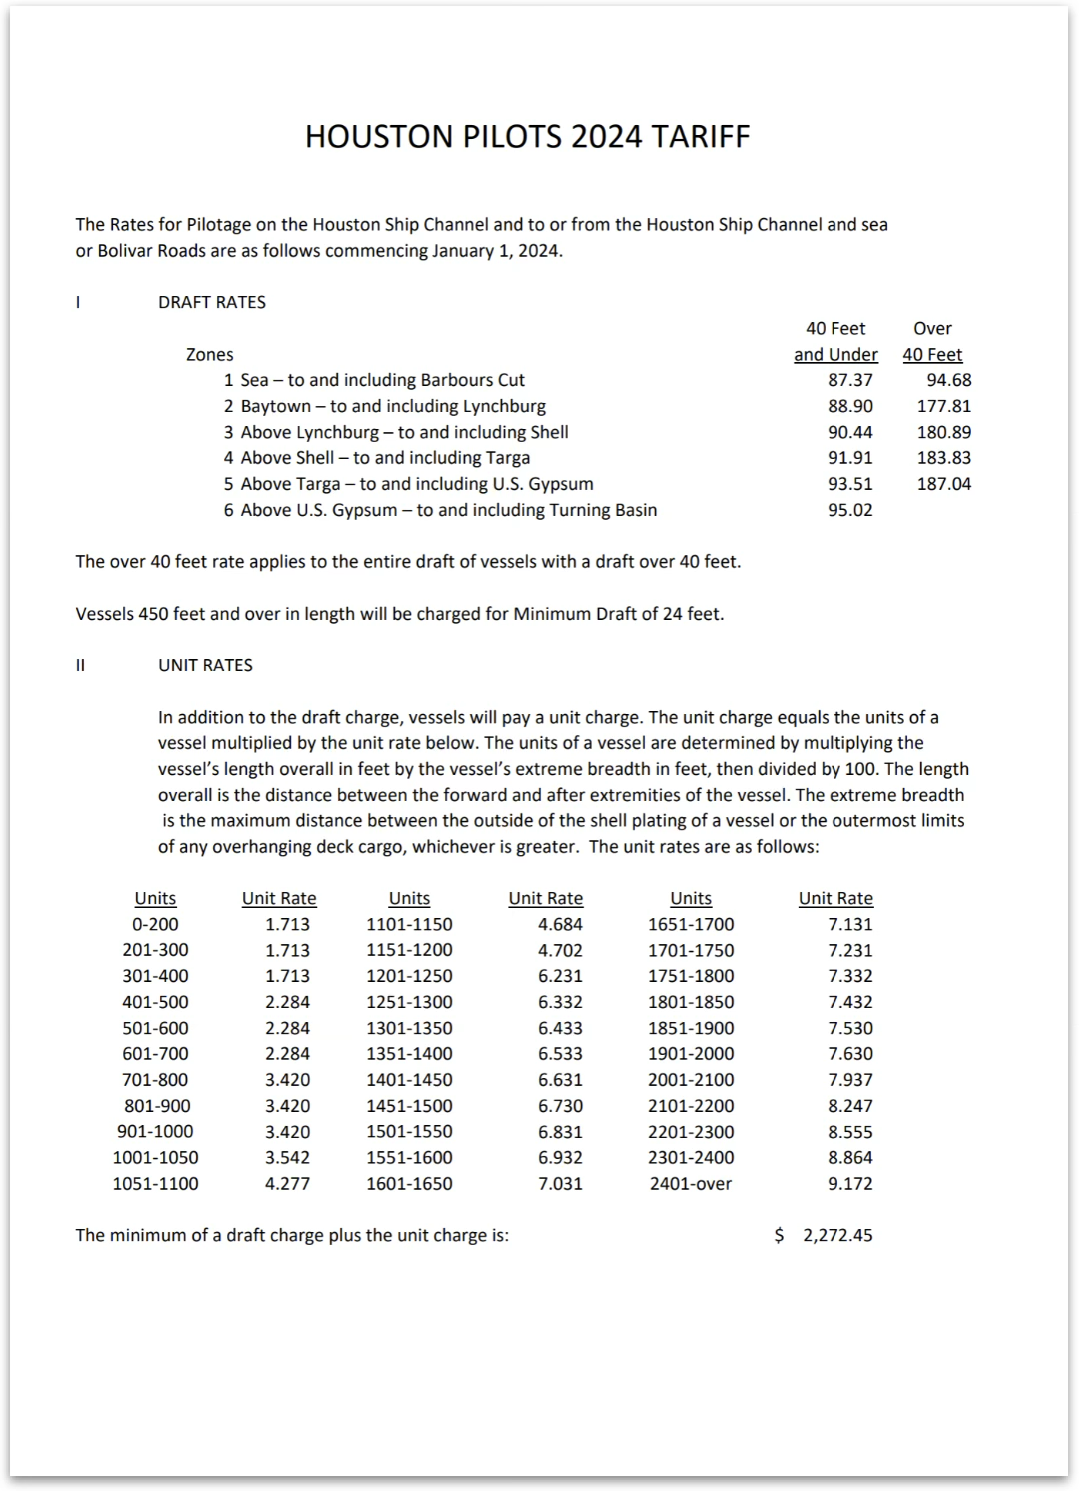
One of hundreds of source documents — the Houston Pilots tariff, where a single pilotage charge depends on zone, draft and a unit rate derived from length × breadth.
Designing the business logic
To build a calculator that could produce a quote instantly, I had to take the pricing logic out of the tariff documents and turn it into formulas and variables. That work is what revealed the true complexity of the requirement — and it is the part a spreadsheet was hiding.
With the logic understood, I could design a system that lets users enter and edit the pricing structure for their own port without a developer in the loop. Some of them were already working in Excel and VBA, so I deliberately kept the interaction close to their existing way of working rather than asking them to learn a new mental model alongside a new tool.
The people who knew the pricing were spreadsheet people. Designing against that skill, instead of past it, is what made local ownership of tariffs possible.
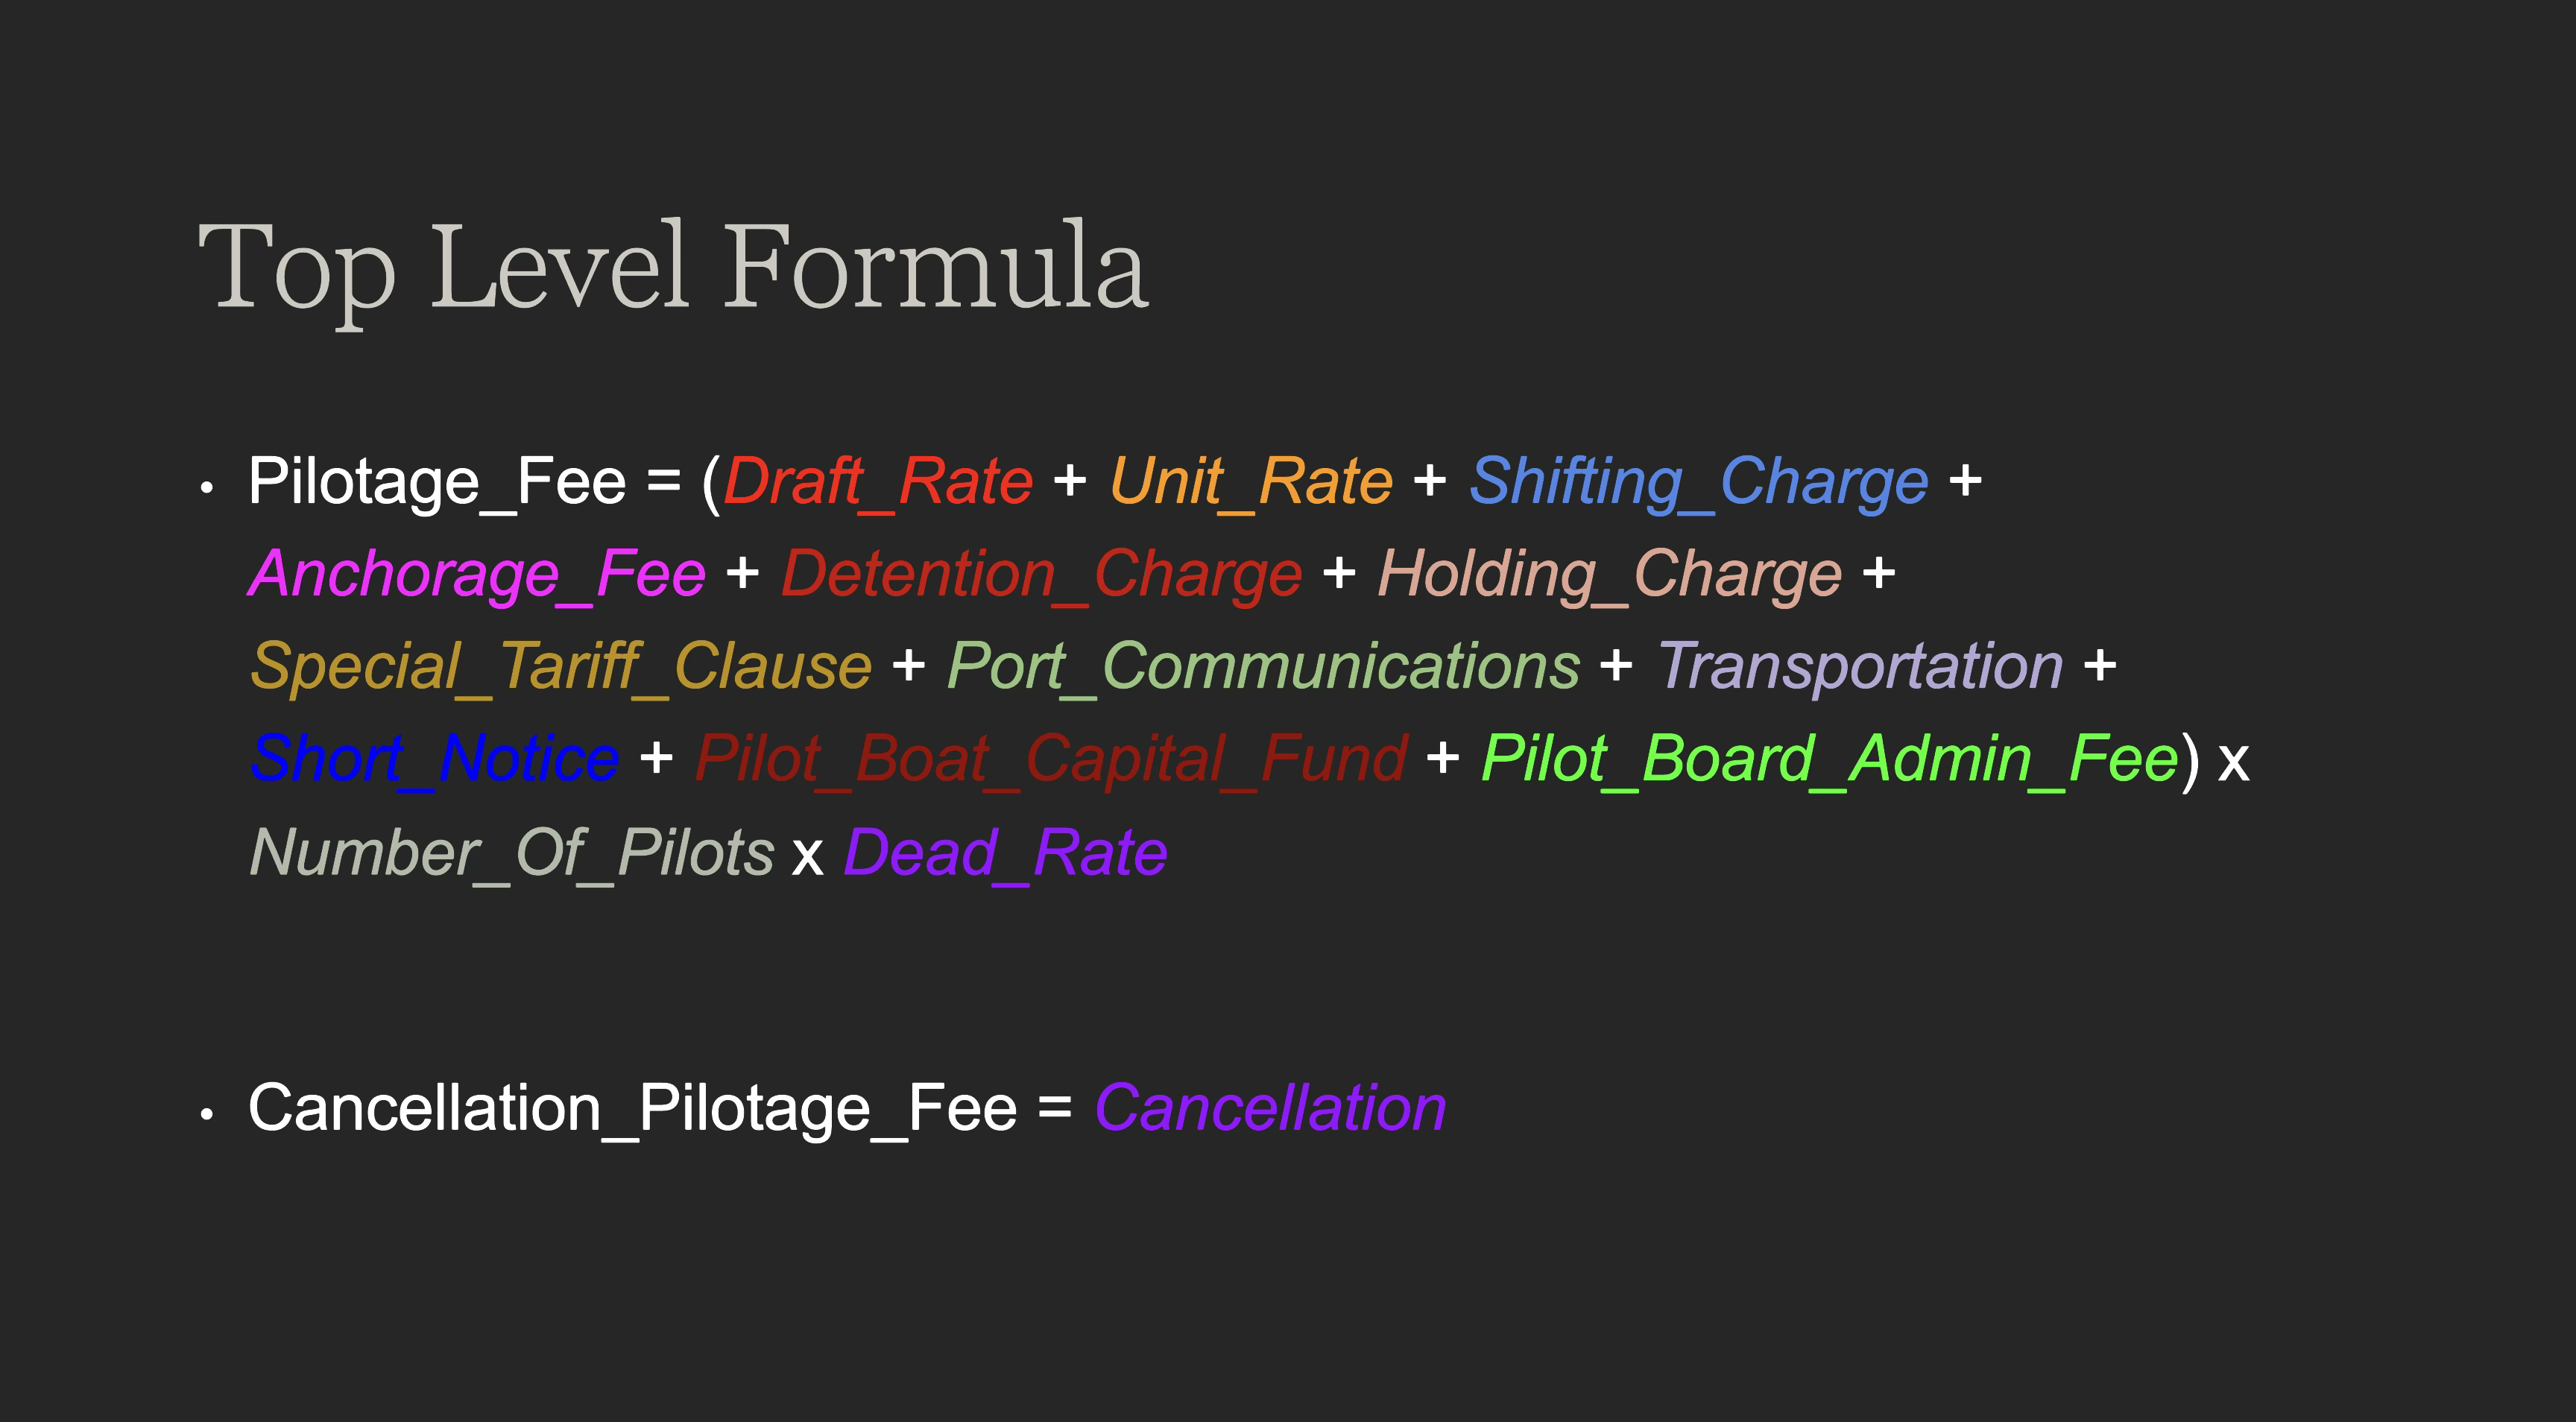
A single charge, written out as a formula — every colour is a variable that has to be looked up, entered or derived.
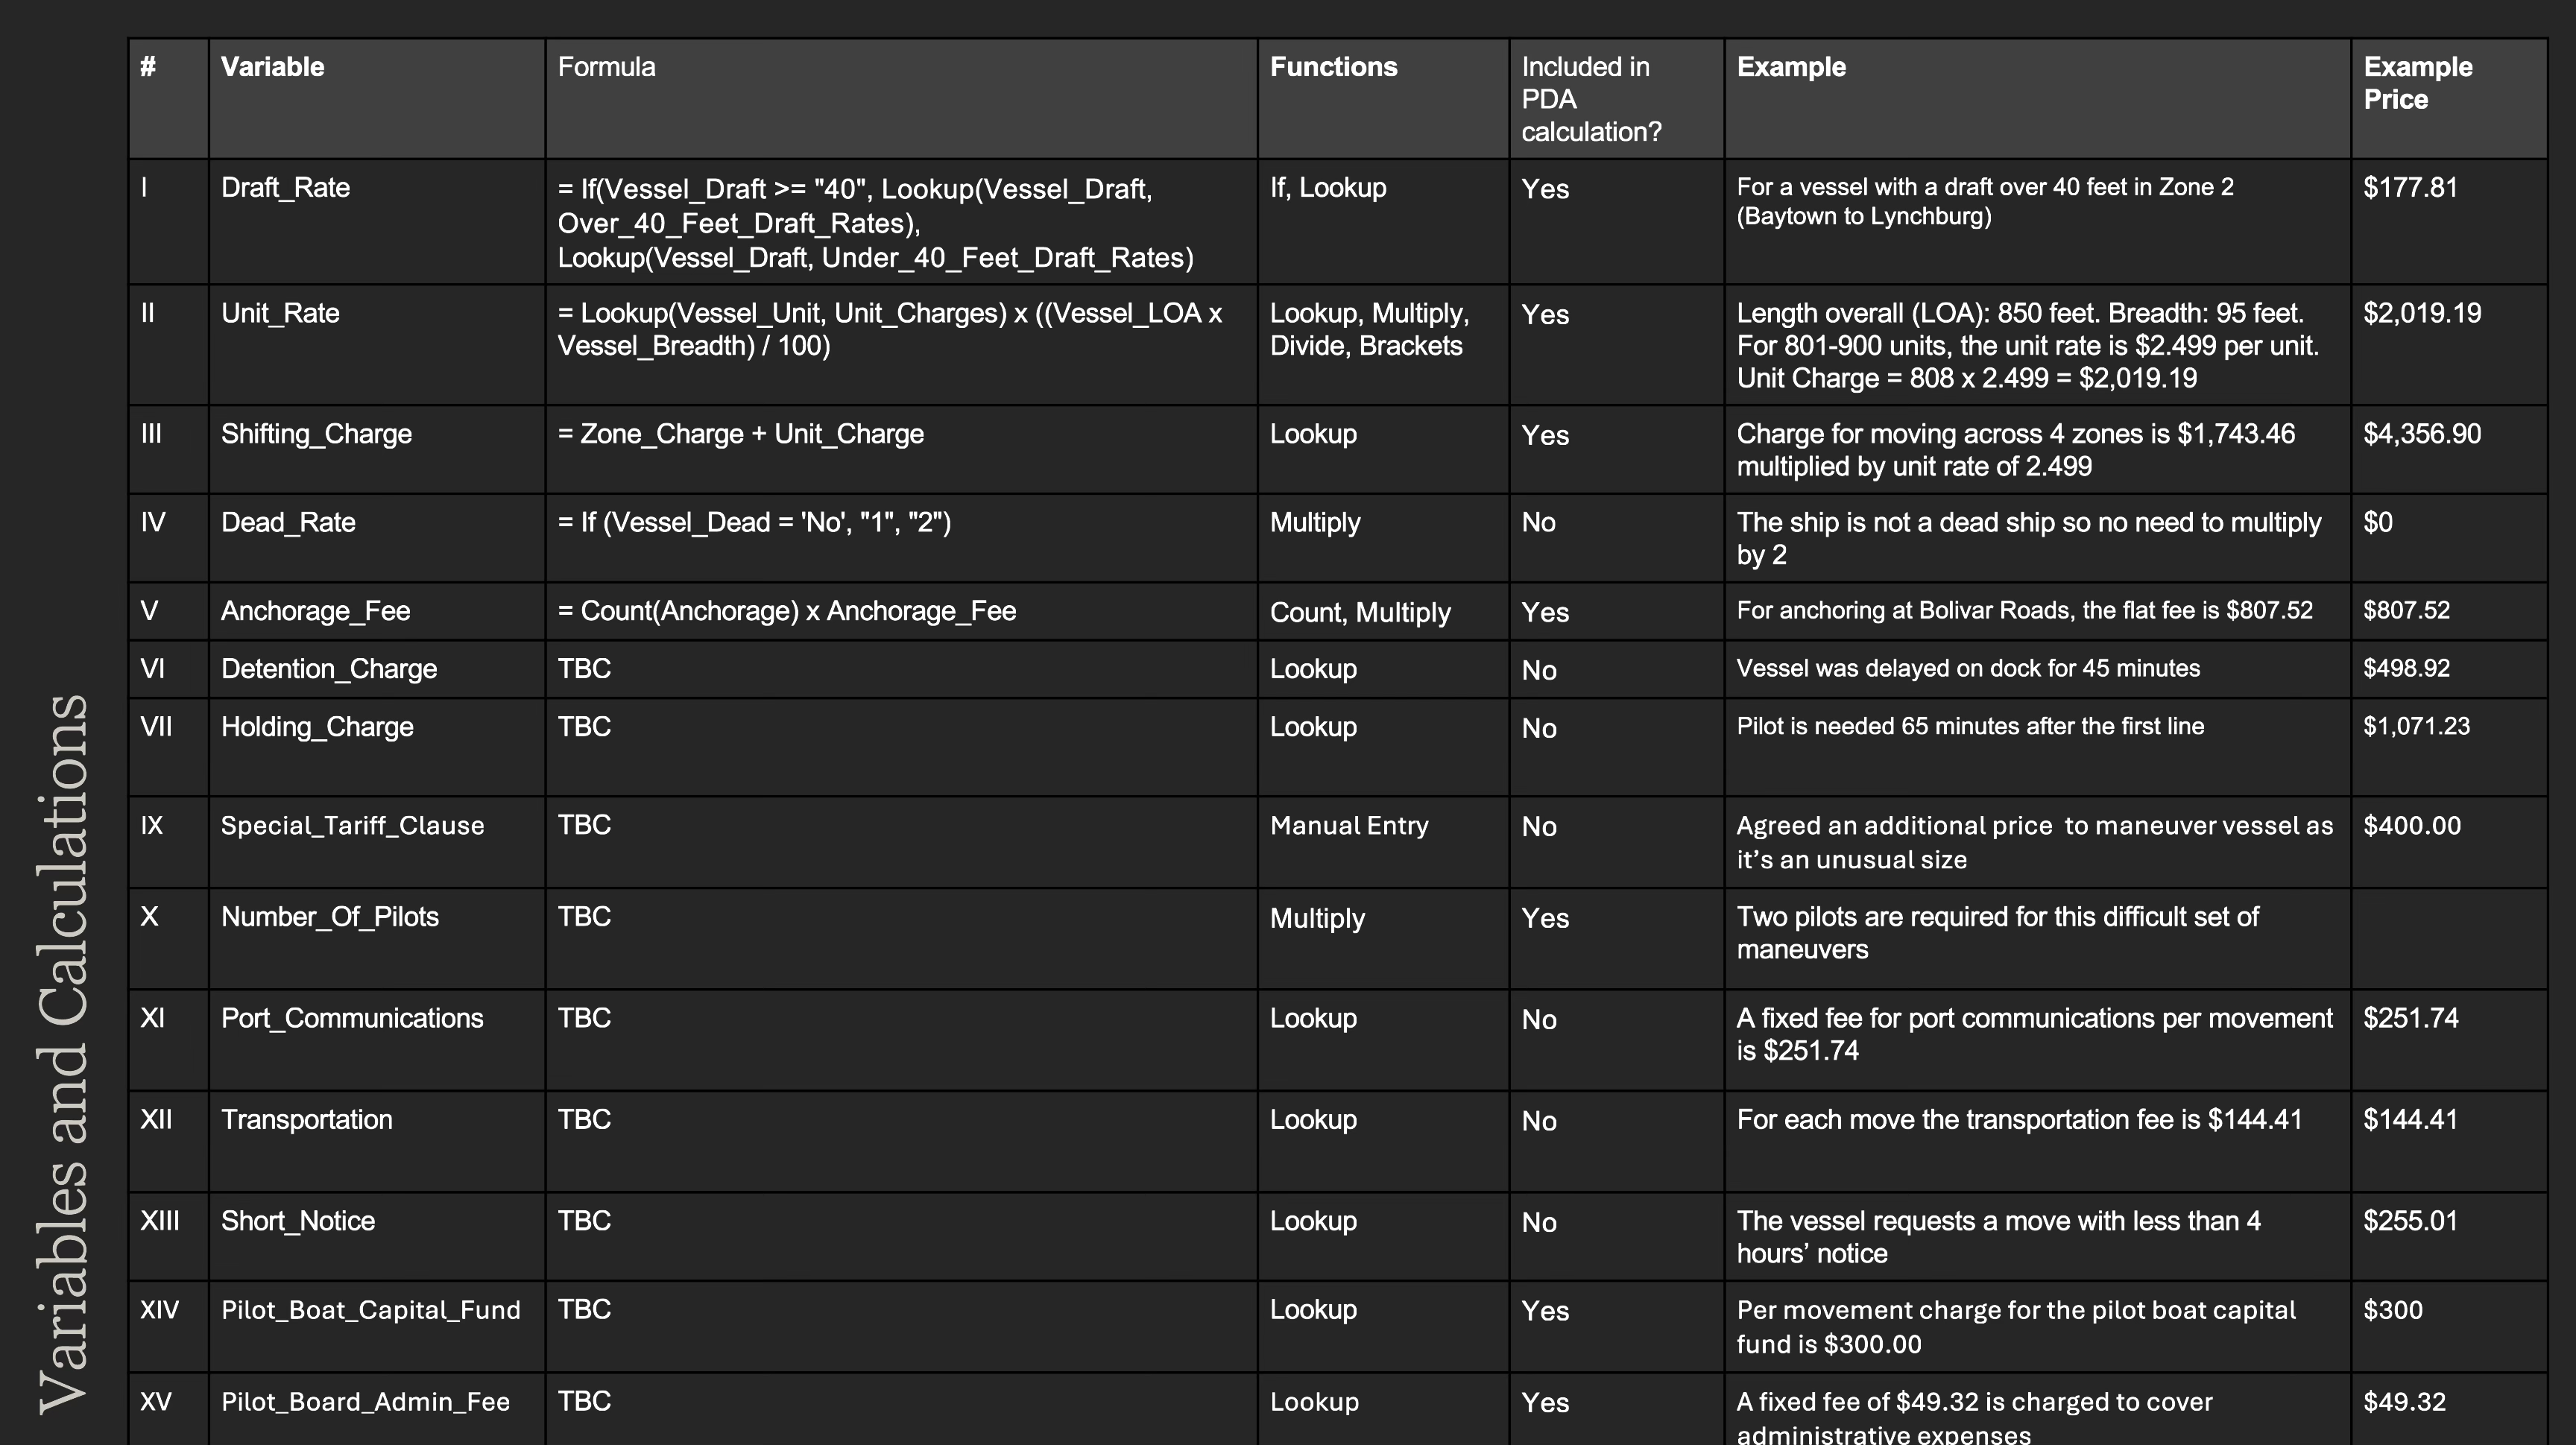
Every variable specified in the open: its formula, the functions it needs, whether it belongs in the PDA calculation, and a worked example with a real figure. This became the contract between design and engineering.
Sketches to wireframes
Sketching first, cheaply and in volume, to find the shape of a quote — then wireframes detailed enough to argue about with pricing specialists and engineers in the same room.
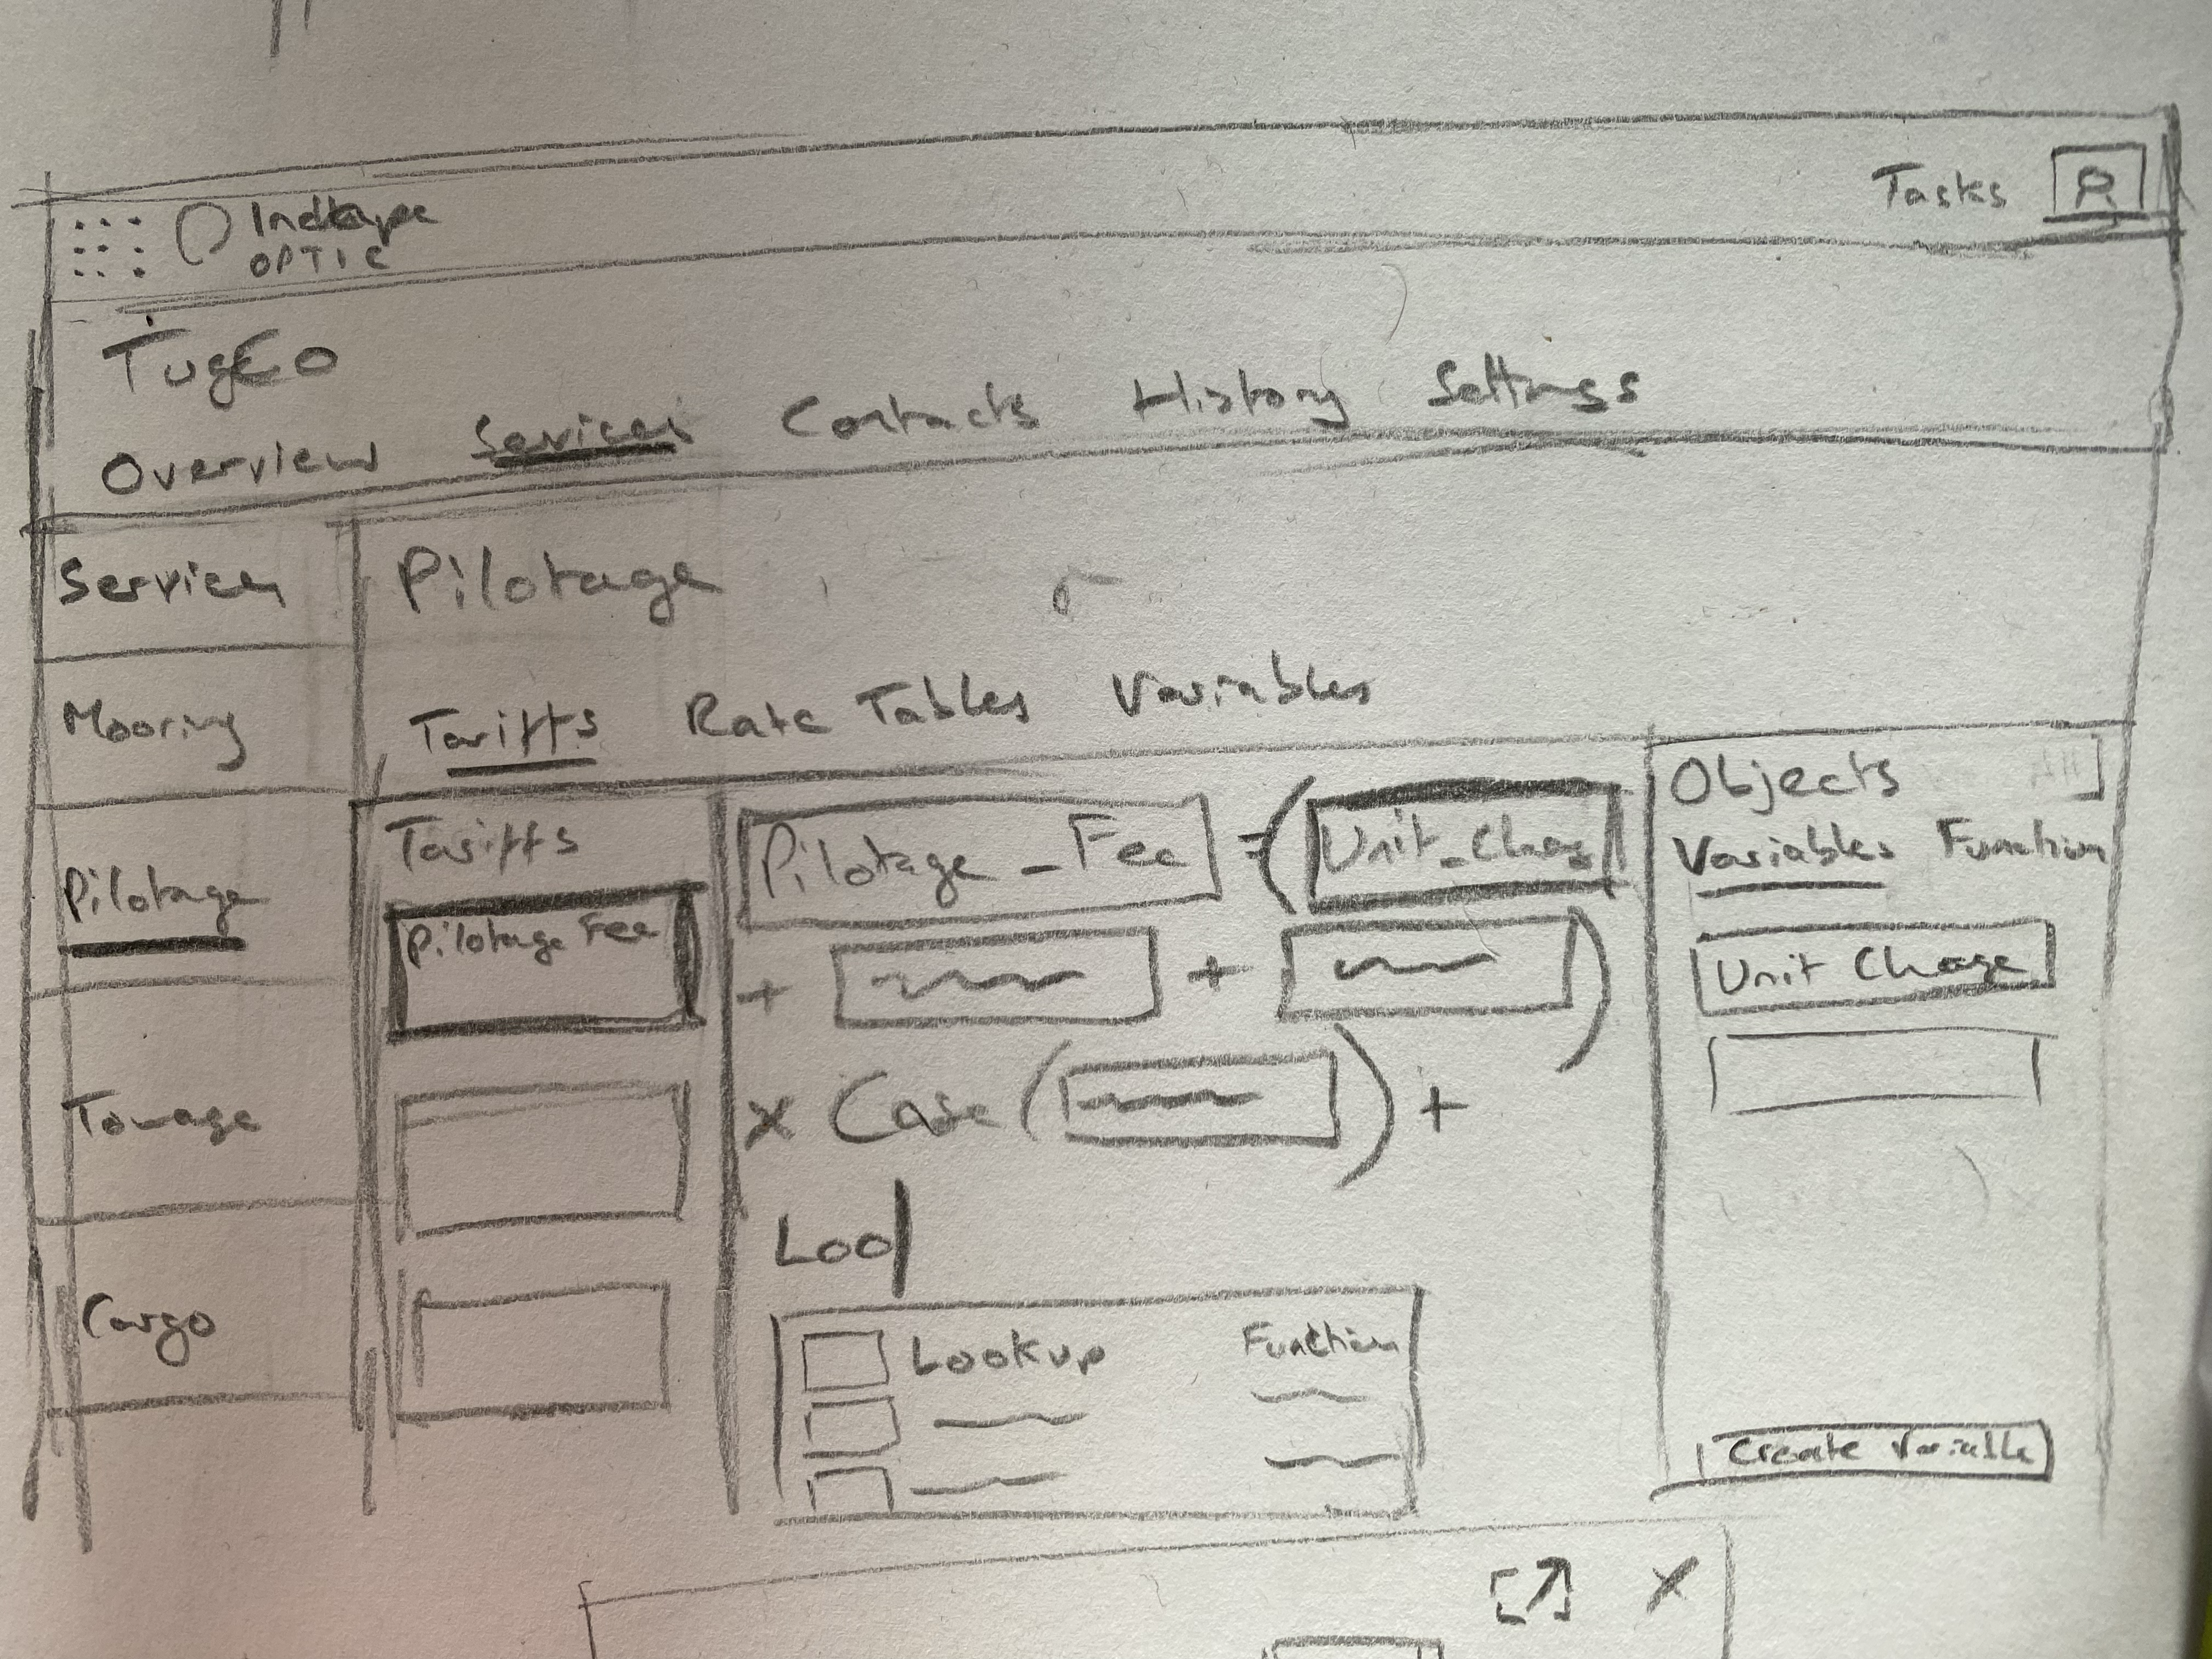
The sketch that settled the layout — services, tariffs, a formula canvas, and a panel of variables to drop into it.
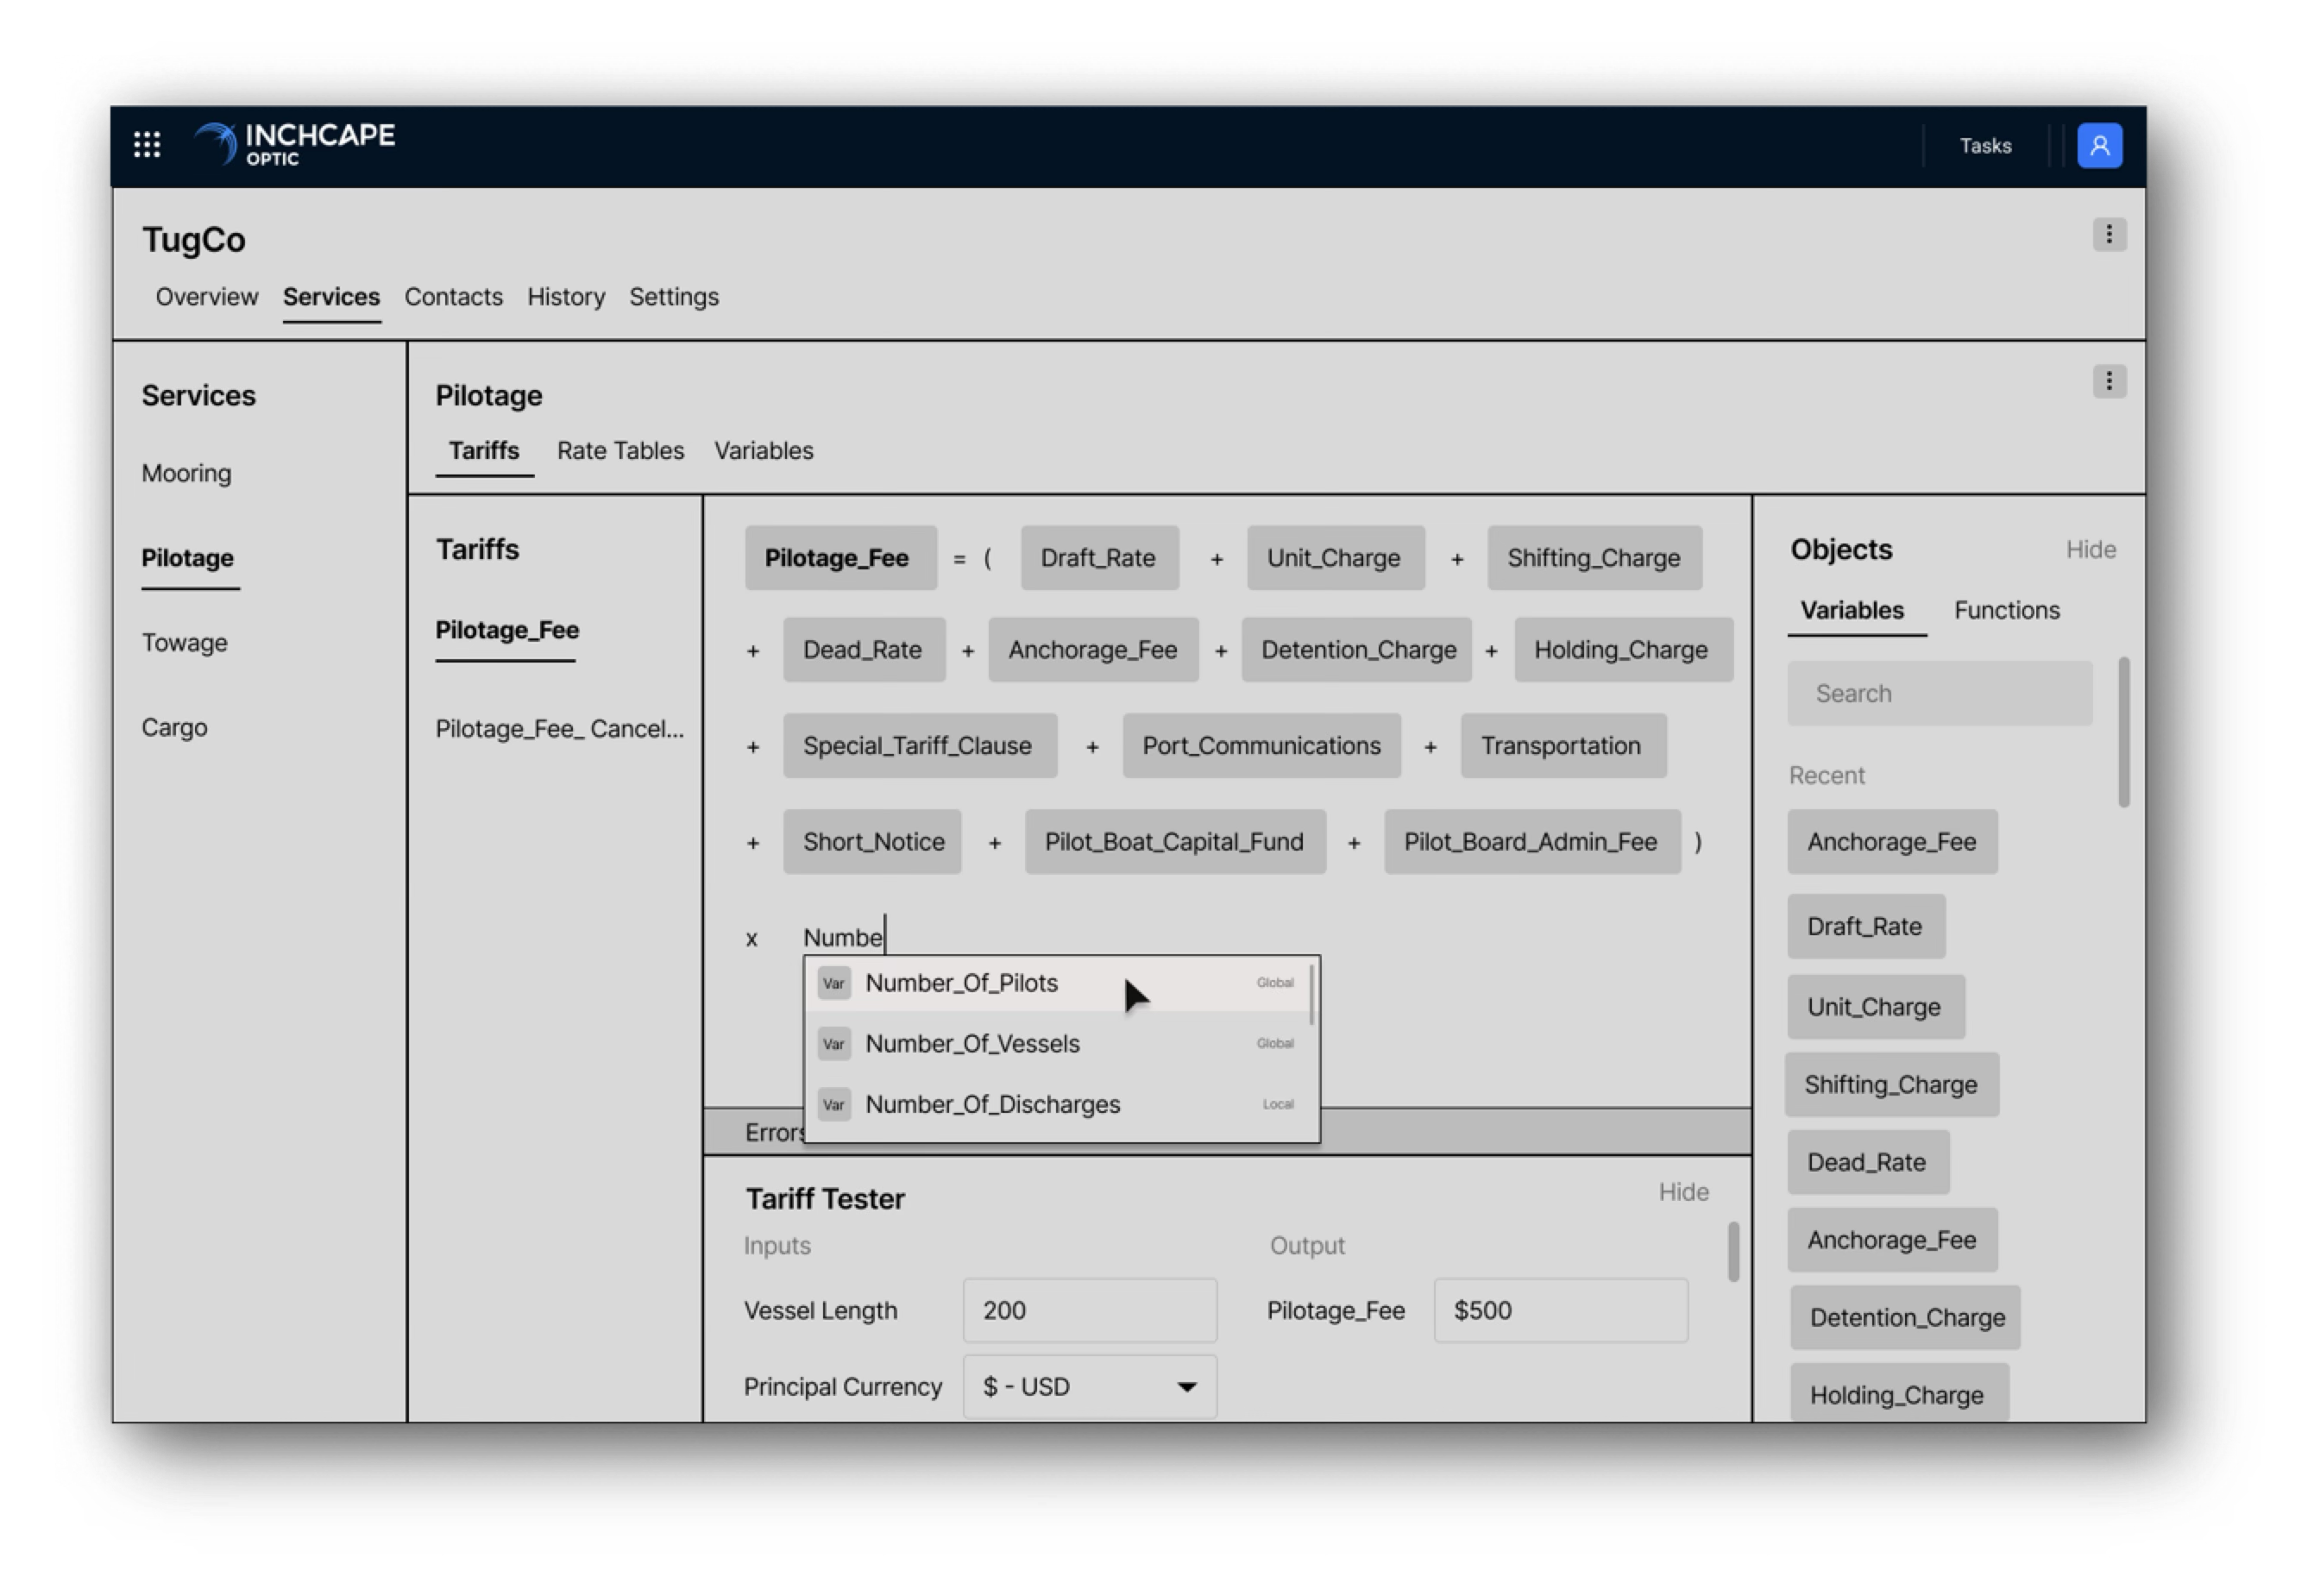
The same screen wireframed — variables as tokens, autocomplete for finding them, and a tariff tester that prices a sample vessel as you build.
User journeys
Journeys for each side of the system: the port agent turning an enquiry into a quote in minutes, and the pricing owner keeping a port's tariffs current. Both had to work, because a calculator is only as good as the numbers behind it.
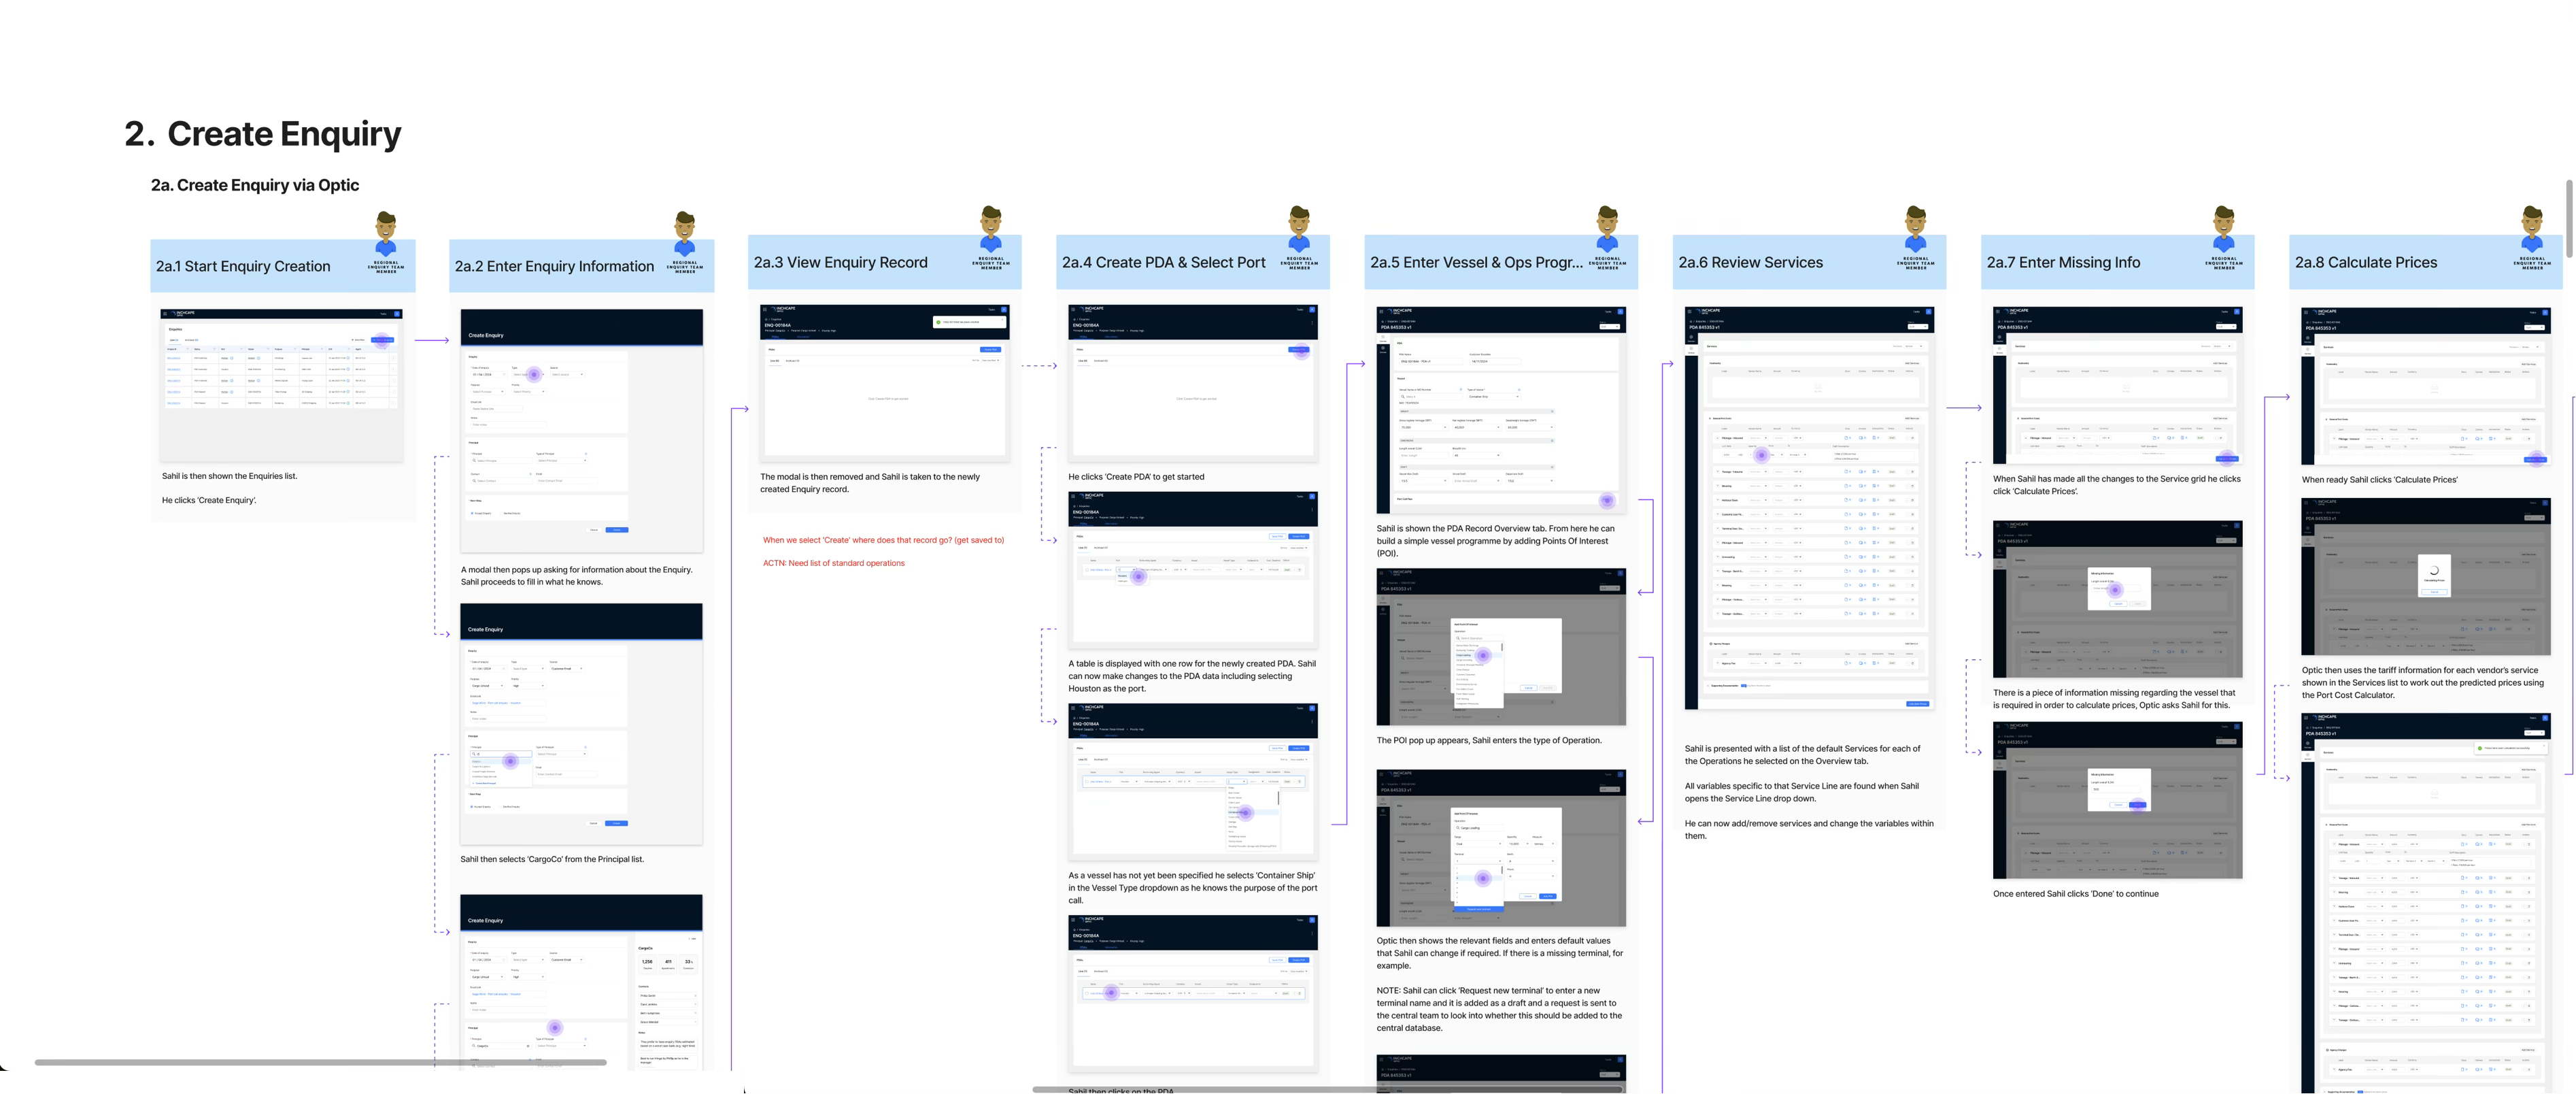
The Create Enquiry journey, annotated screen by screen — including the open questions and actions we still had to resolve. Scroll to follow it across.
User feedback, and how we prioritised it
Feedback came back from ports around the world, each with a local wrinkle they considered essential. Taking all of it would have produced a system as unmanageable as the paperwork it replaced.
So we prioritised it in the open — scored against the impact on quote speed and on how defensible the resulting invoice would be, then fed back into the build in slices. Ports could see where their request sat and why.
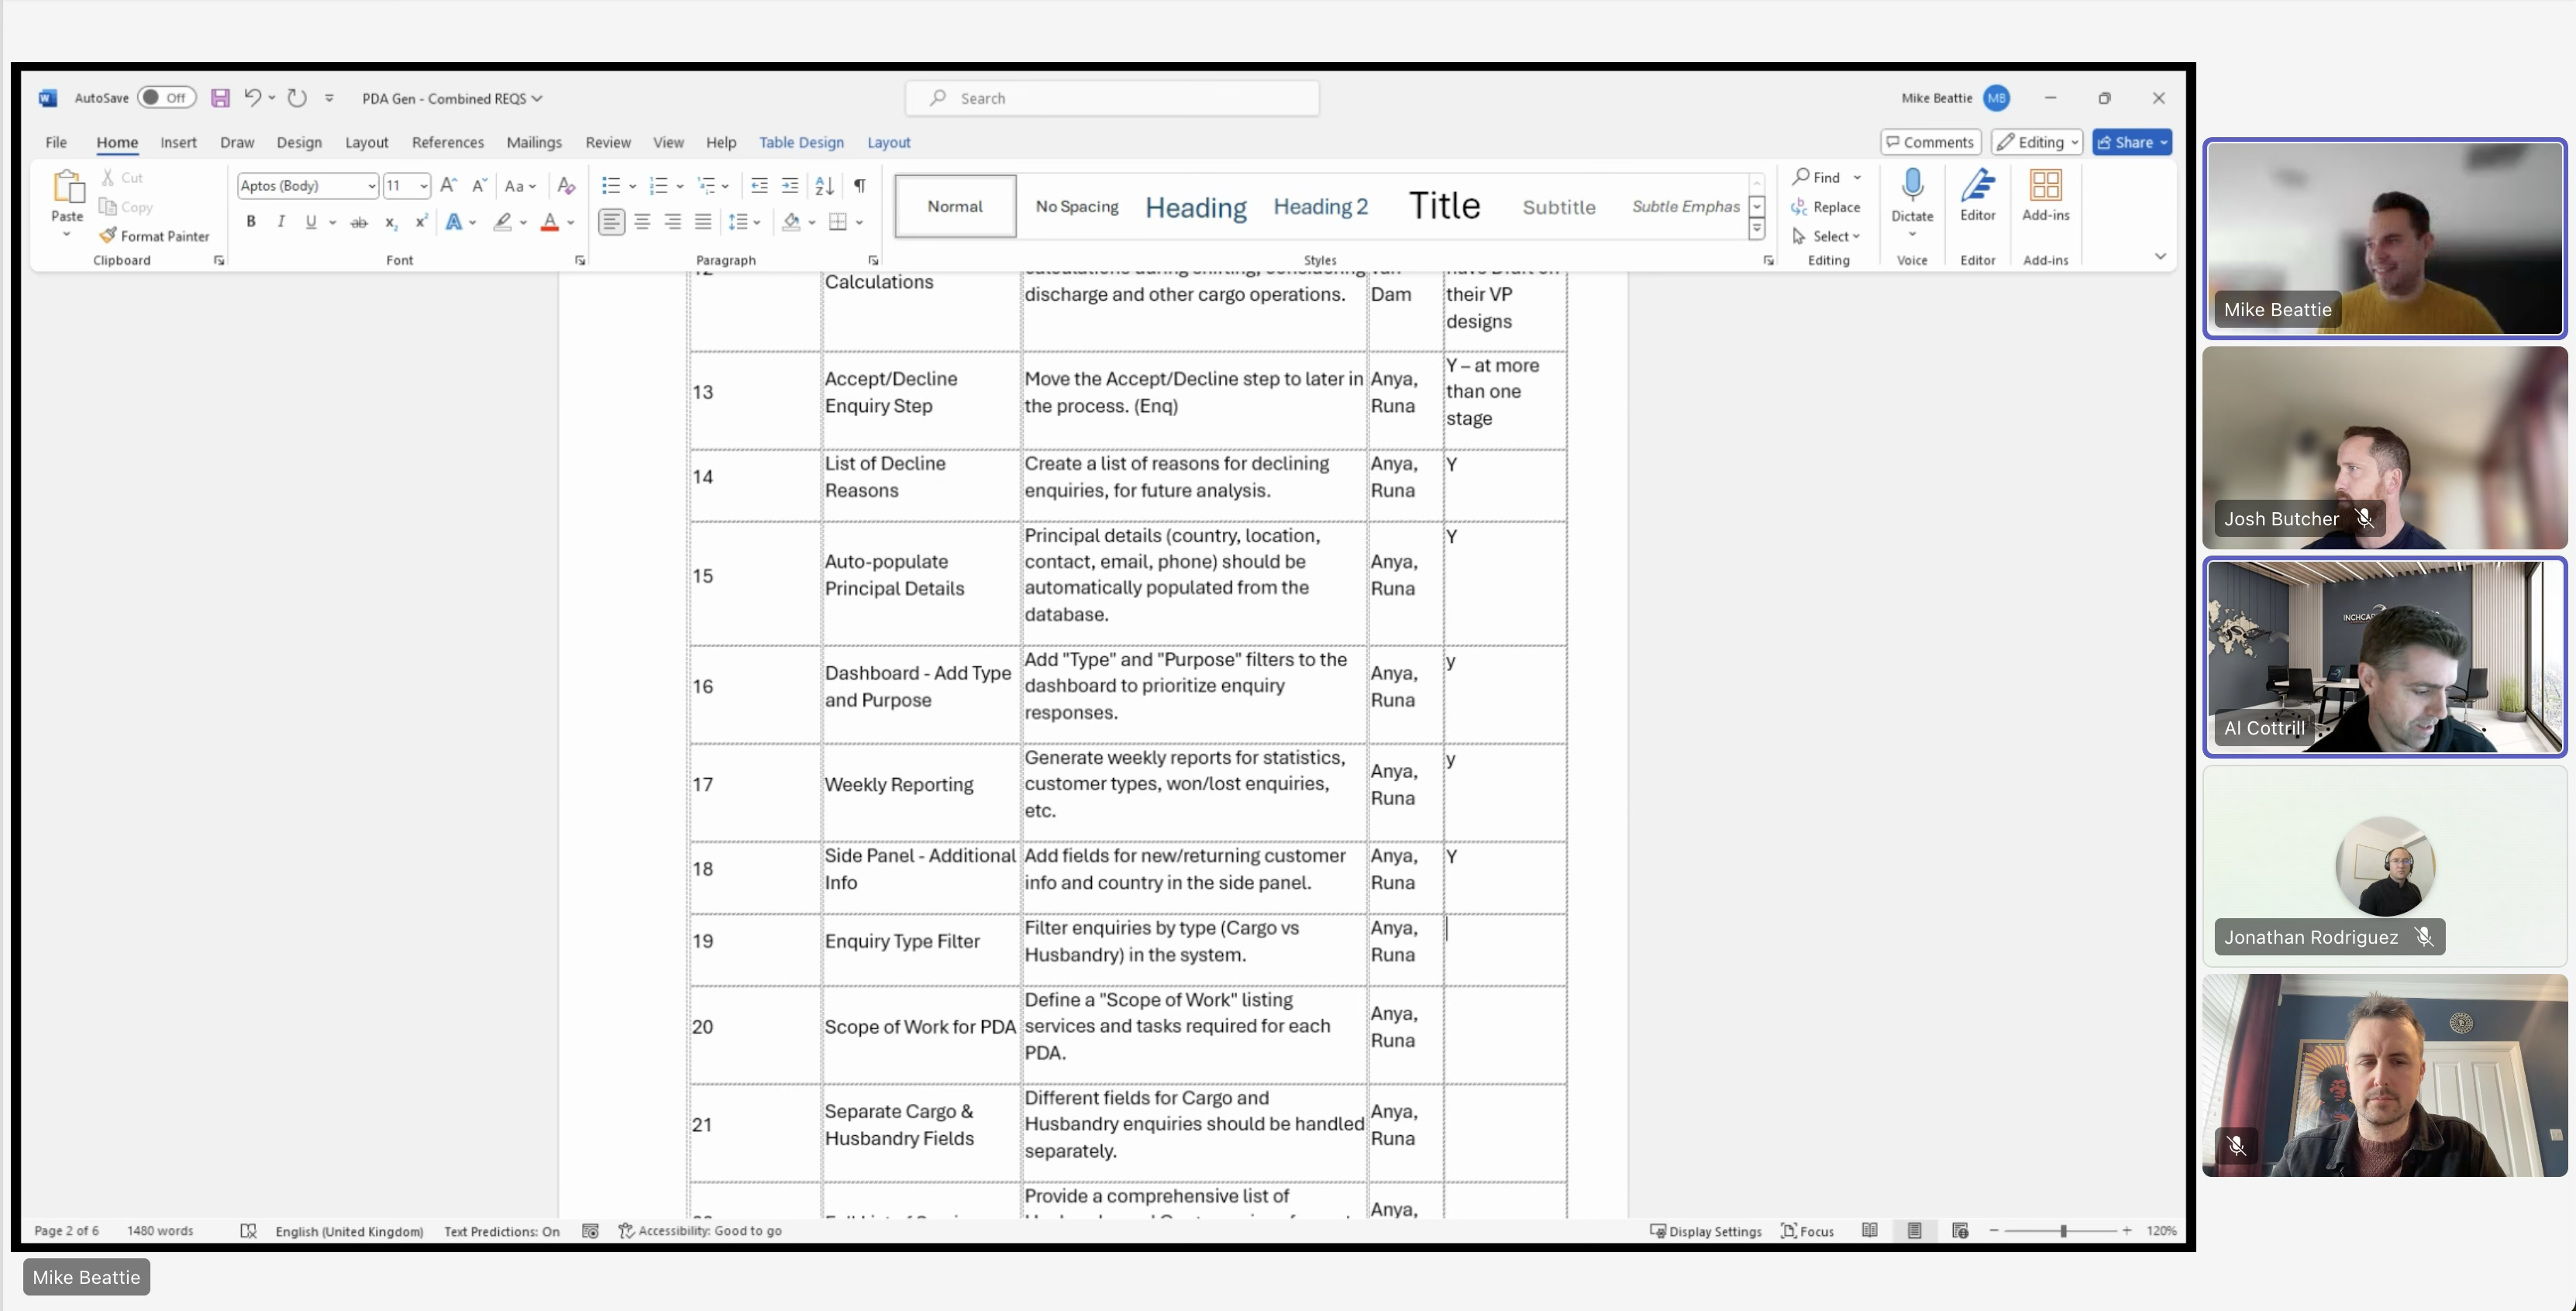
Working the combined requirements list with the team on the call — every request numbered, described, owned, and marked in or out of the next slice.
Design library
A library of the components this product leans on hardest — dense tables, editable rate rows, numeric inputs and states — so the calculator stays consistent as more ports and services come into it.
Underneath it, a token layer: one font family with seed and alias sizes, and a colour table where every shade is published with its contrast ratio and pass level. Dense financial tables are unforgiving about contrast, so the decision was made once, in the library, rather than per screen.
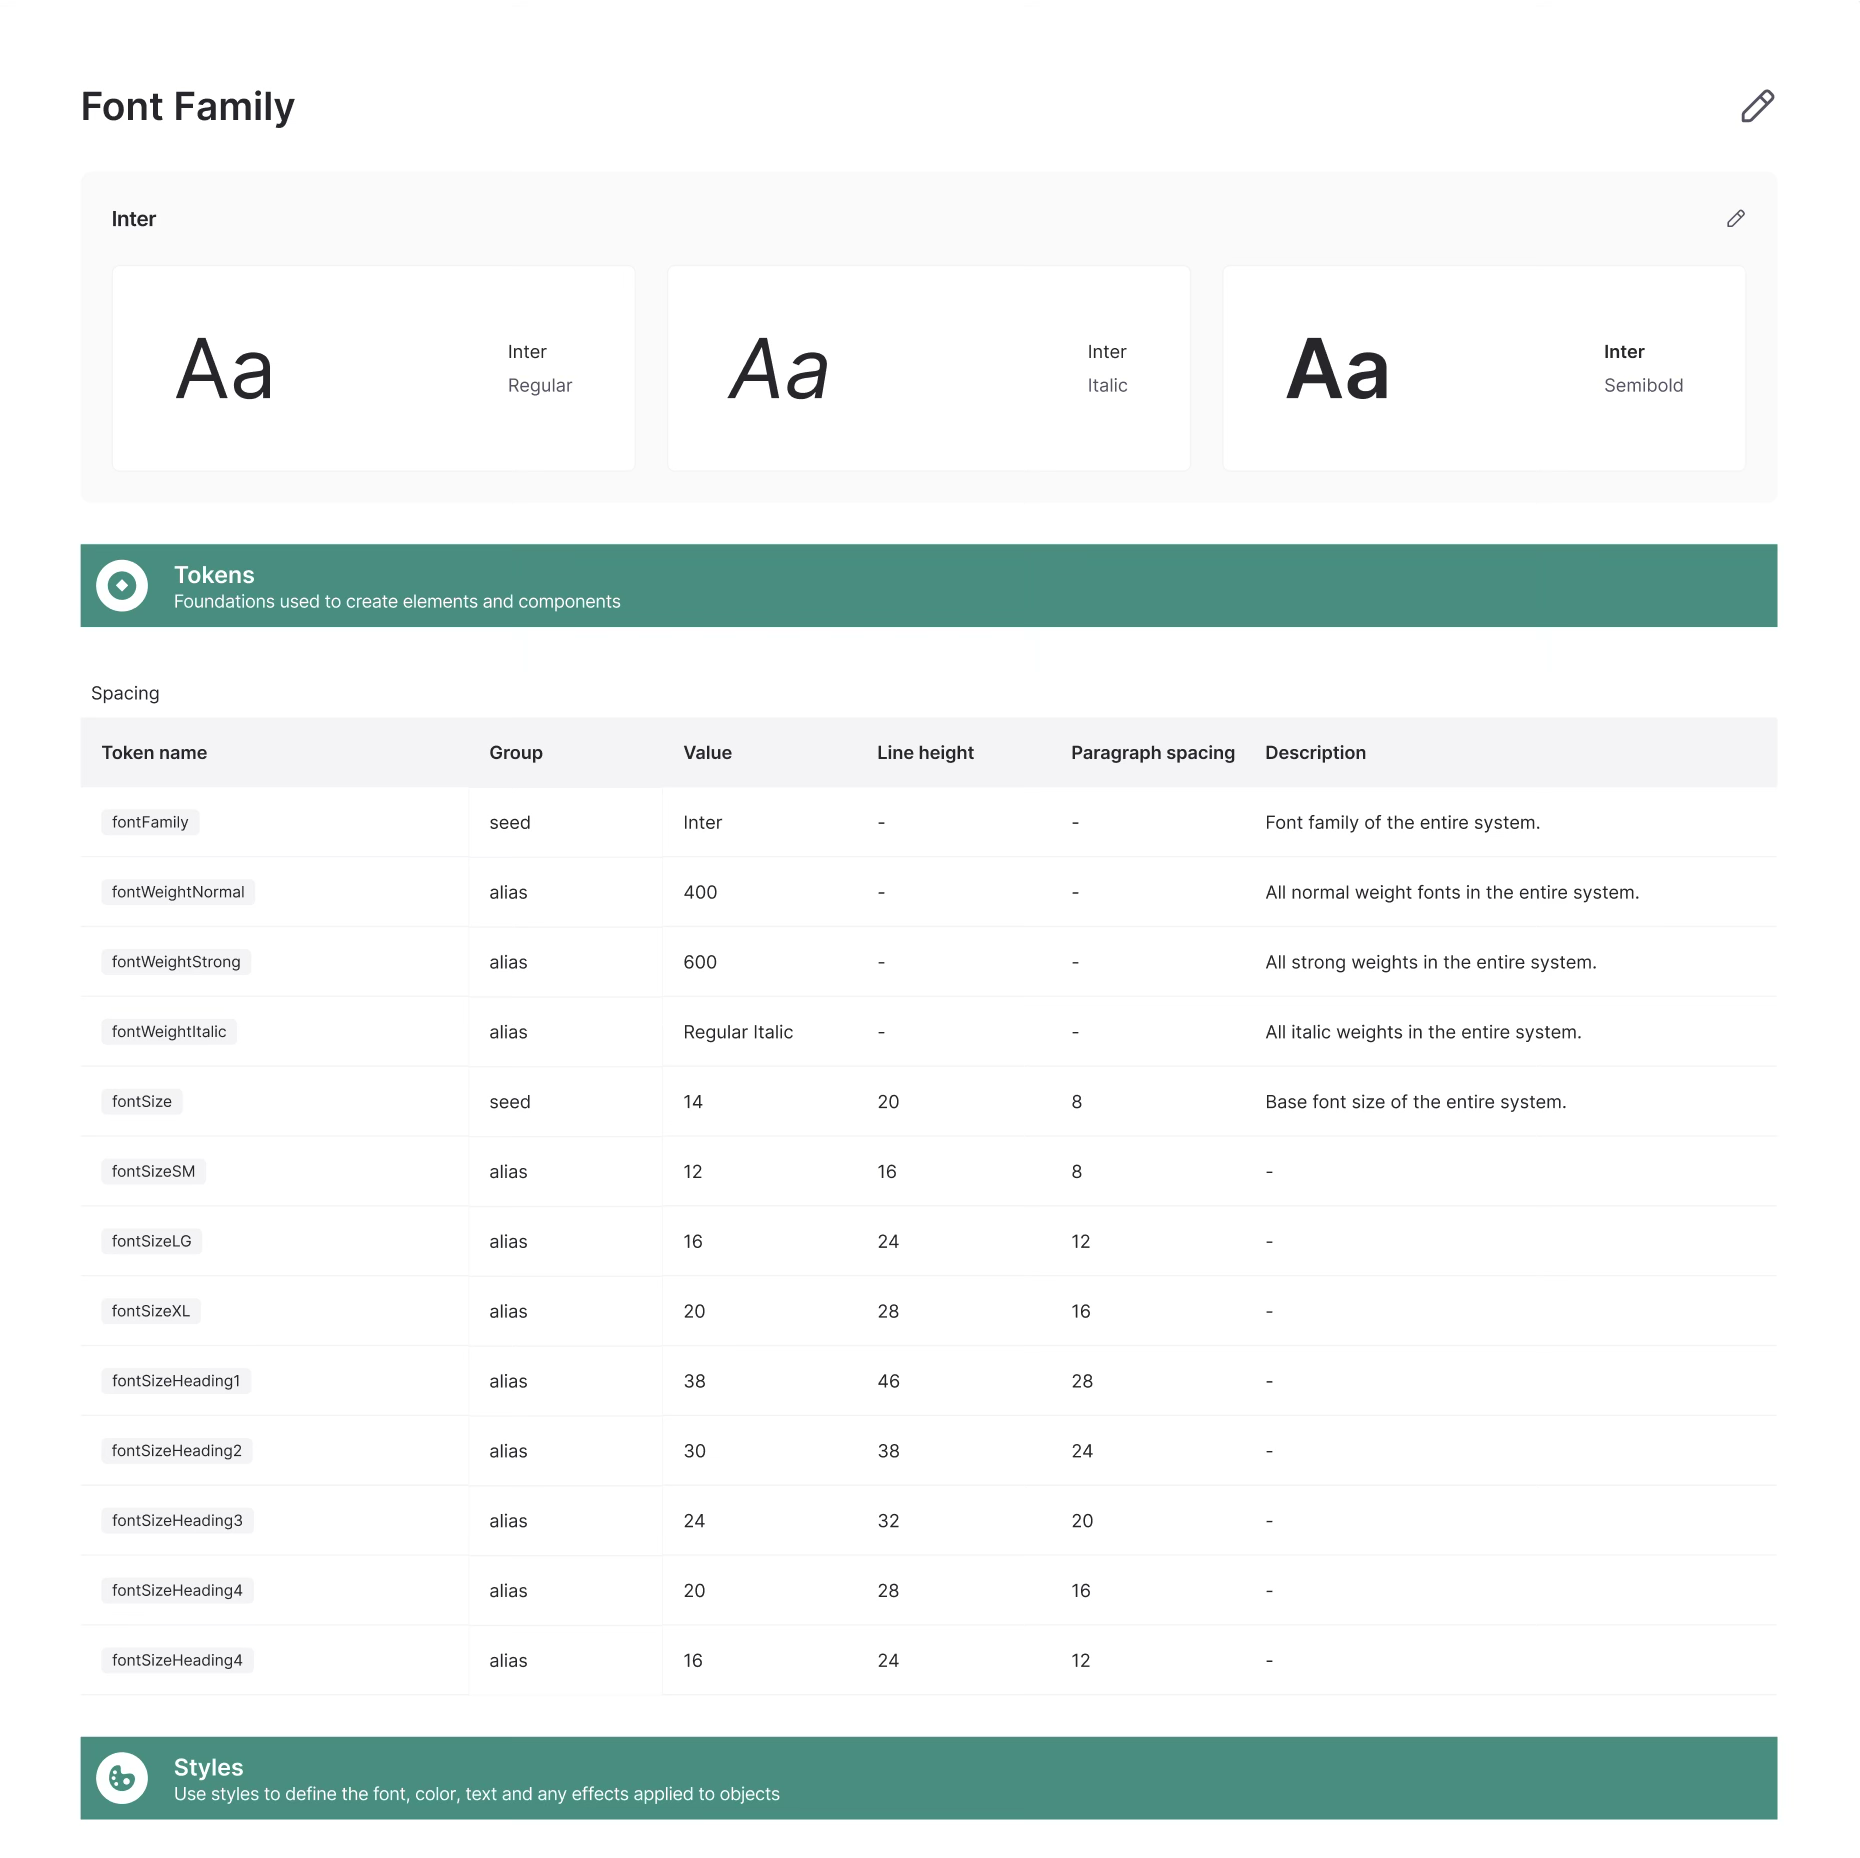
Type as tokens — seeds and aliases, so a size change happens in one place.
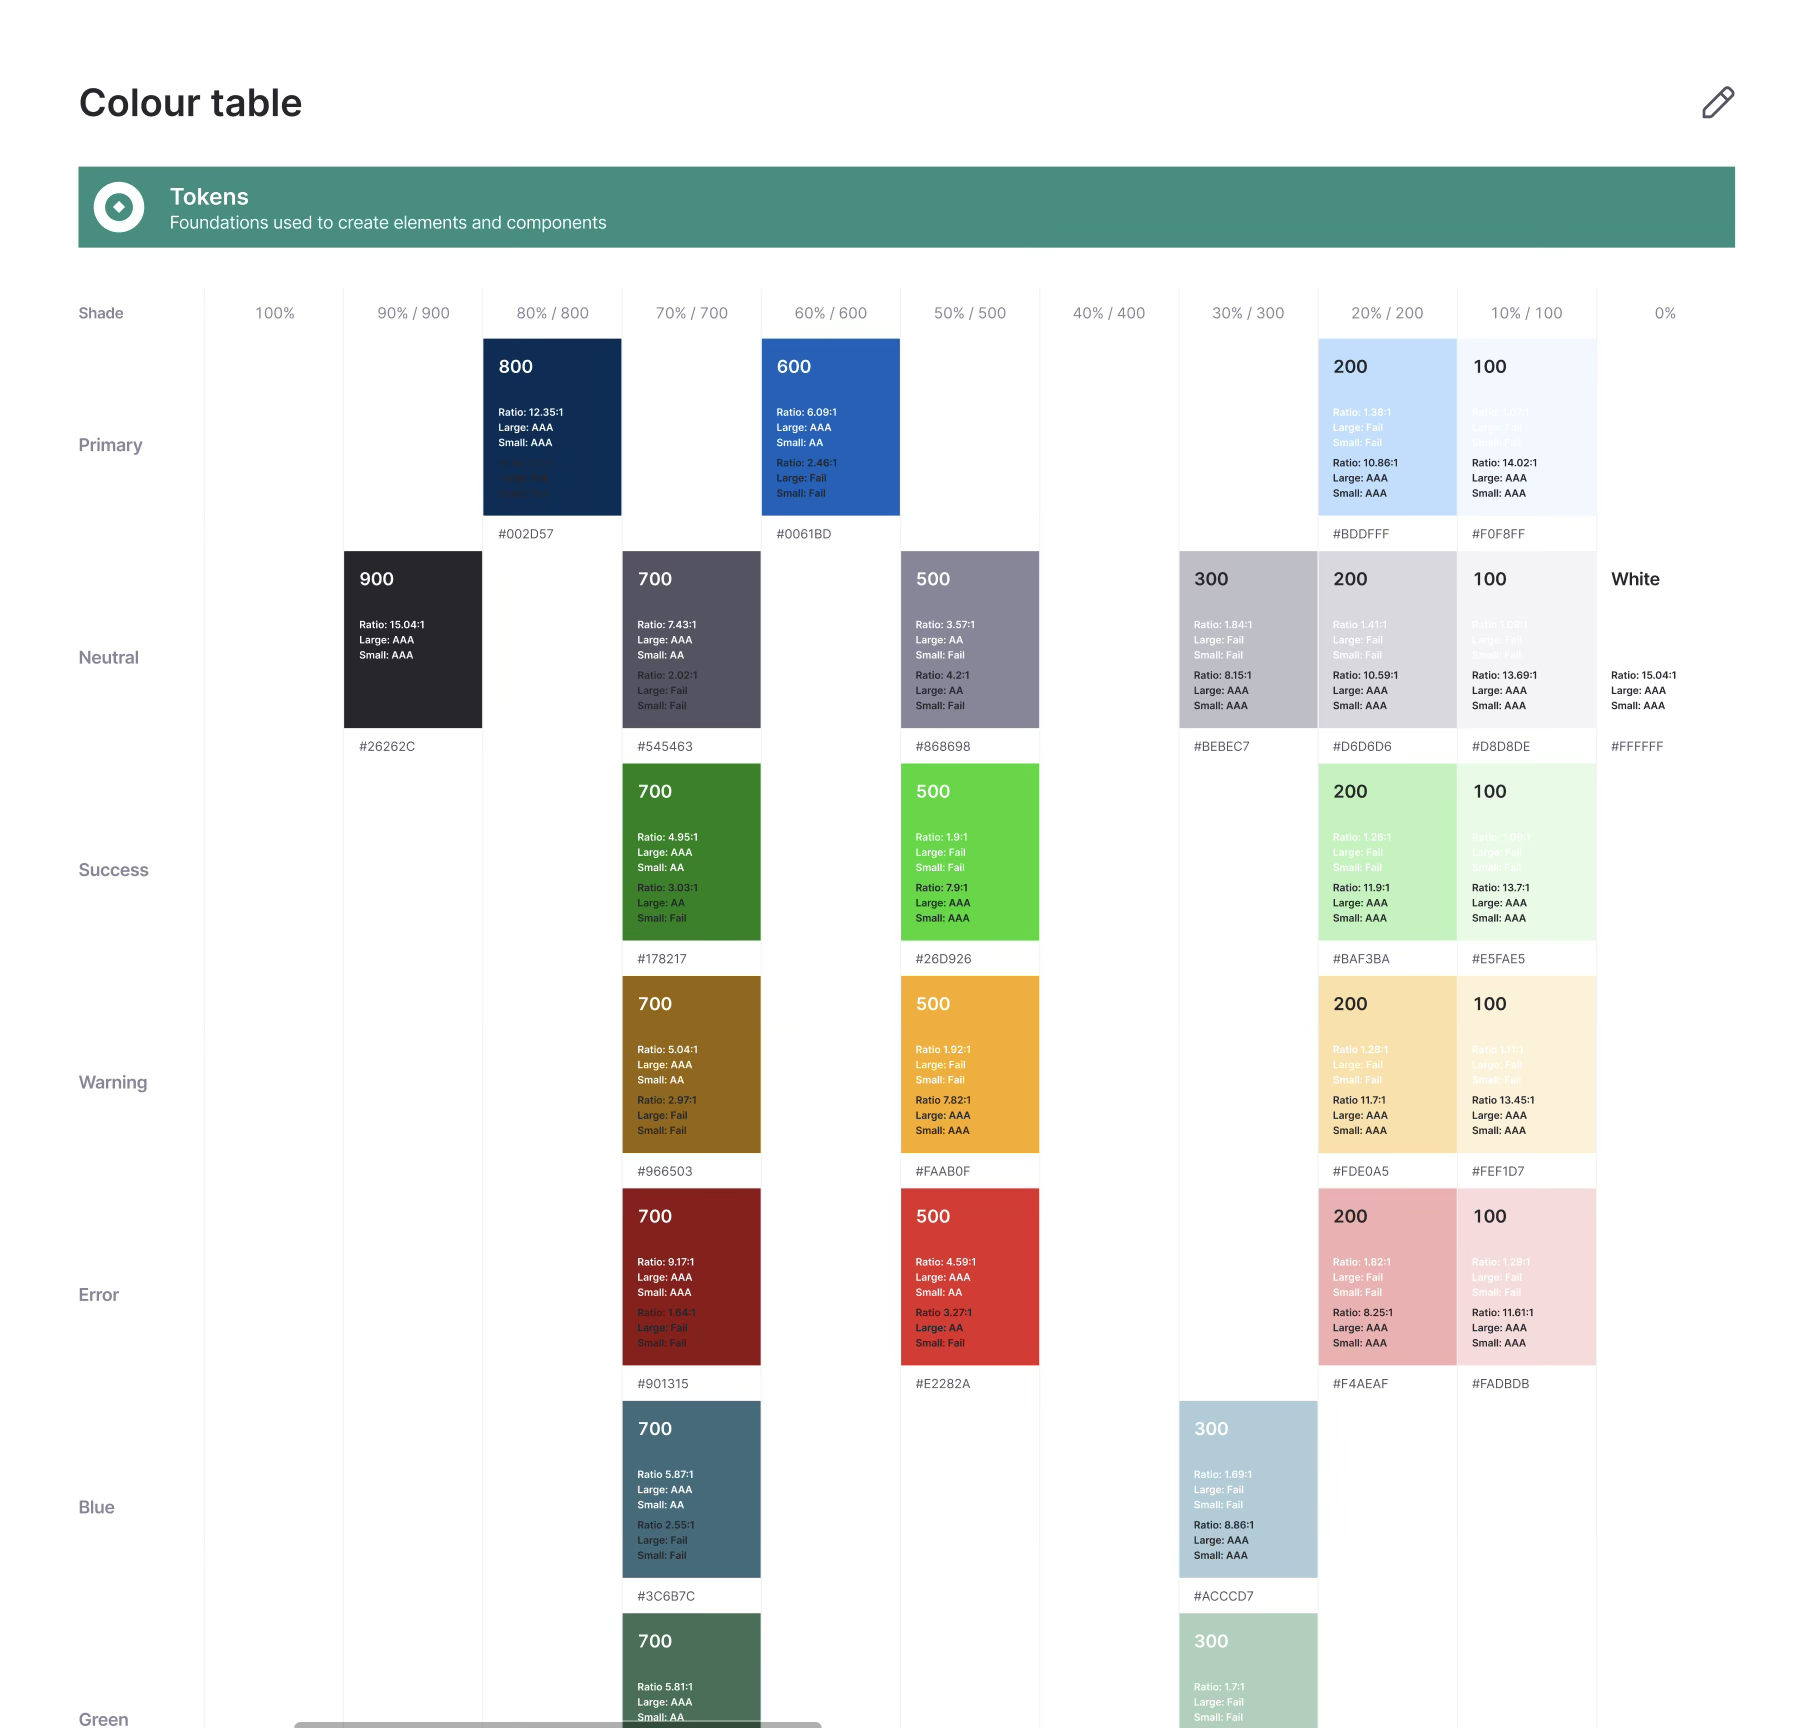
The colour table — every shade published with its contrast ratio and whether it passes for large and small text.
Final UI design
A port cost calculator that produces a quote from a vessel and a port instead of from an afternoon of document-hunting — and leaves a record of how every figure was reached.
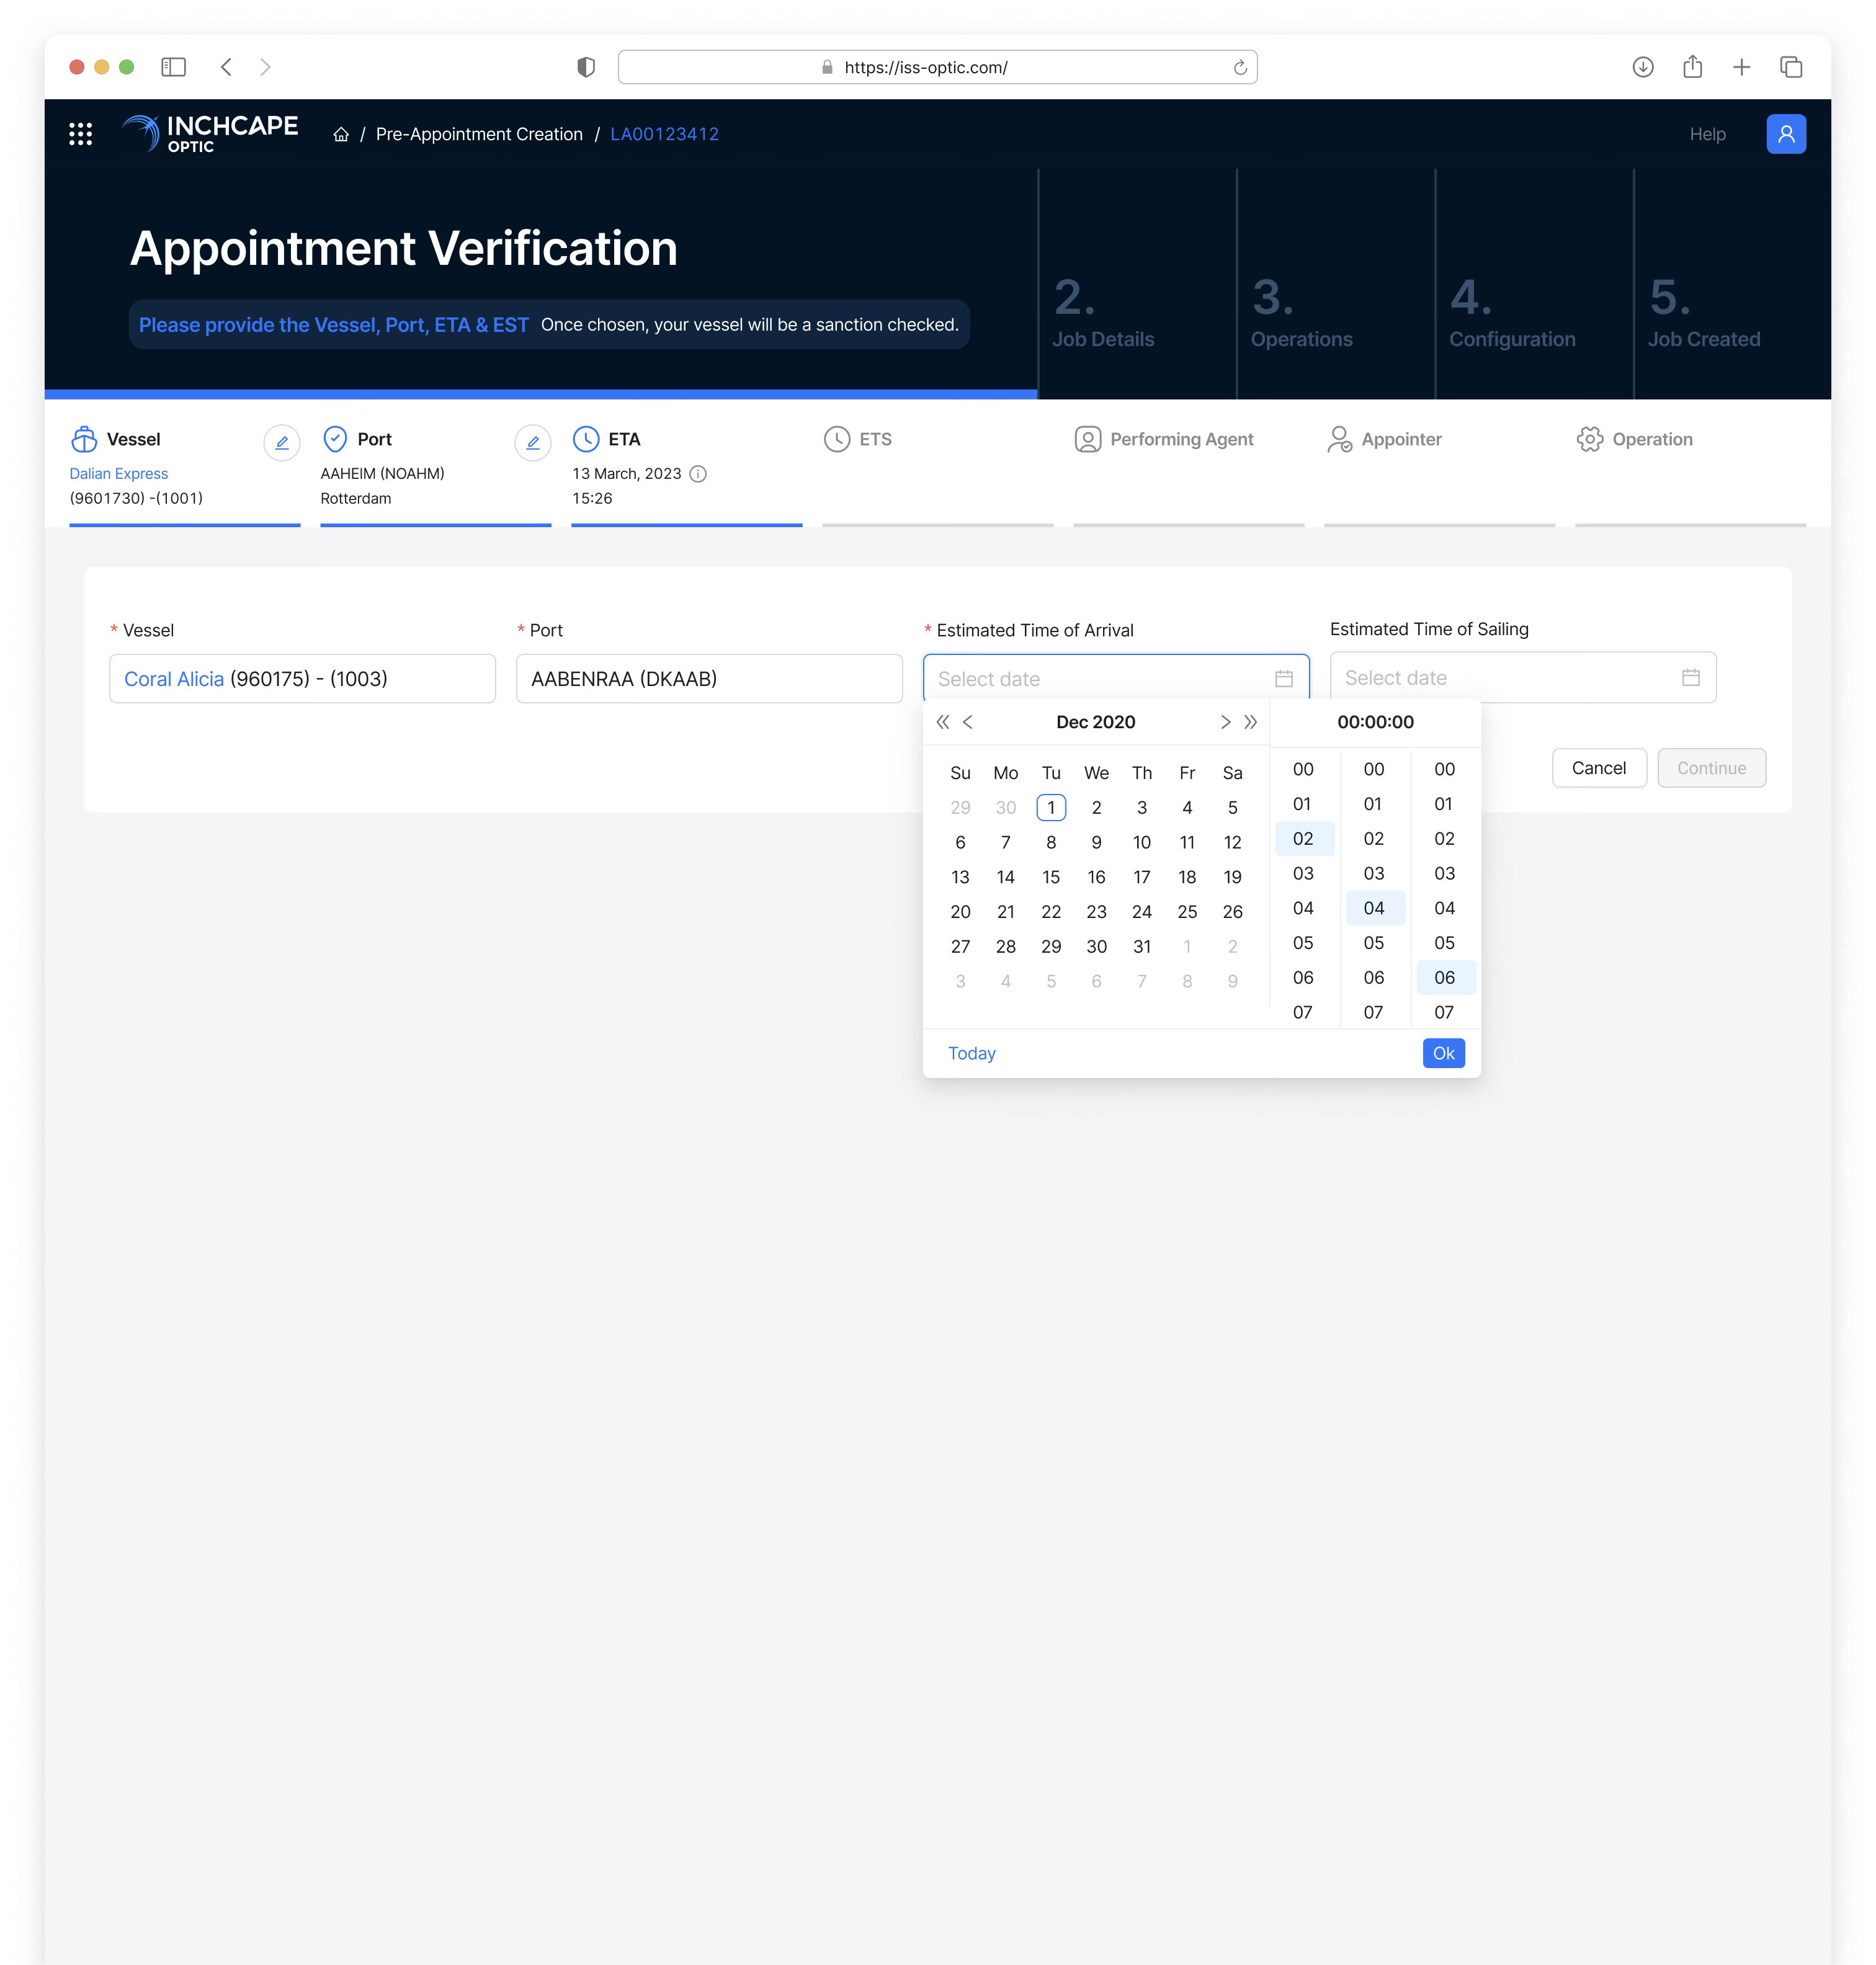
Starting a job: vessel, port and times, with the five steps ahead shown and the vessel sanction-checked as soon as it is chosen.
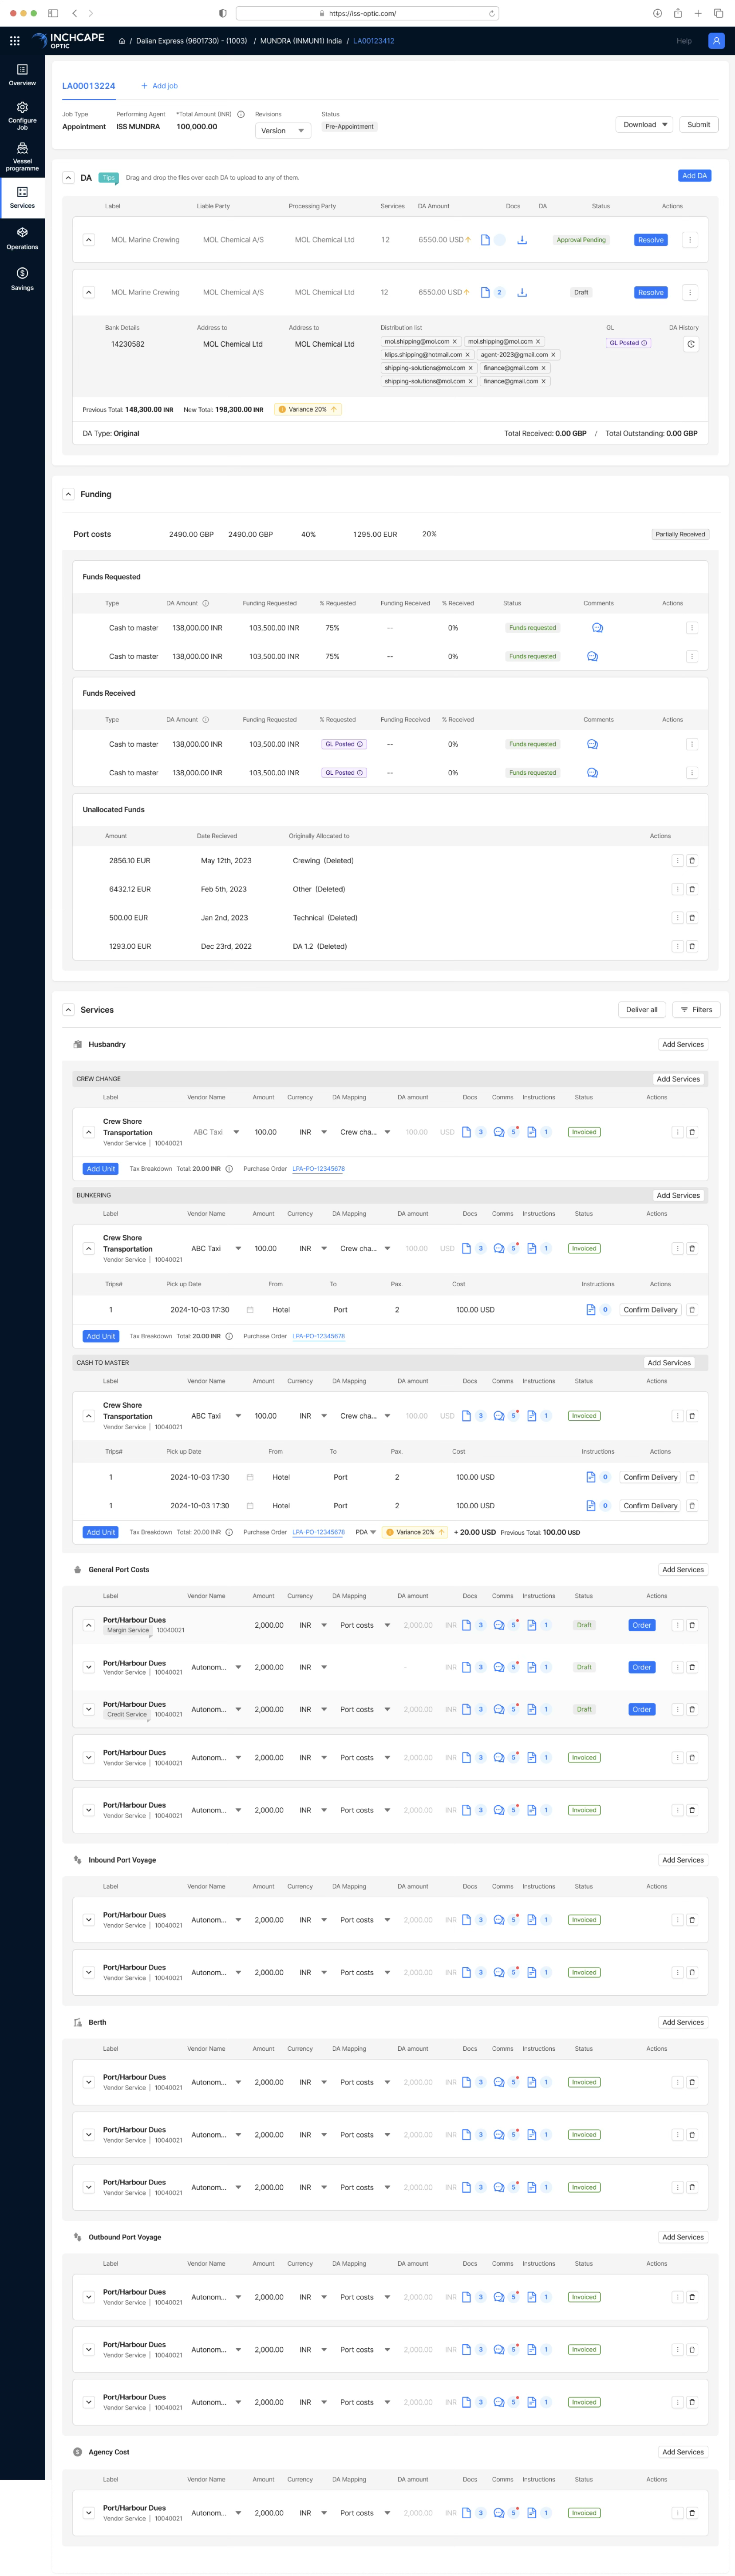
The full job, end to end — DAs, funding and every service line priced and status-tracked. Scroll inside to see its length; that whole record used to be paperwork.
What I took from it
Deriving the pricing formulas myself was the design work. Without it, every screen would have been a guess at a domain I didn't yet understand.
Designing close to Excel wasn't a compromise — it was how we got tariff owners to trust the system with their own numbers.
The commercial win wasn't faster quotes on their own. It was a quote you could trace, which is what makes an invoice stick.