Managing
deliveries
Enabling large multinational customers to manage the purchase, delivery and use of Castrol oils
Castrol's biggest customers — mines, transport fleets, distributors and workshops — ran their oil supply on phone calls, spreadsheets and hope. We mapped the whole service, then designed the tool that gave both sides a live view of every order.
The problem
A mine or a transport depot can't run without oil. But nobody on either side of the relationship could see where an order actually was. Customers phoned Castrol and waited on hold; Castrol's own systems and the customer's stock systems were separate, so inventory went out of sync and the same order got processed twice.
The existing ordering tool, Castrol Express, was described by customers as clunky, with regular log-in problems. When a delivery was short or back-ordered, no one told the customer — they found out when the truck arrived without it.
So the brief was not "build an ordering screen". It was: make the delivery of oil visible, predictable and self-service, for six very different customer segments at once.
Neither the customer nor Castrol can see where an order is — how do we give both sides one live, trustworthy view of every delivery?

The context that set the stakes: plant that costs thousands an hour to stand still, waiting on a drum of oil nobody can locate.
Methodology
A hands-on, human-centric approach applied at every stage: understand the people in the service chain, reframe their pain as opportunity, then design and test against it. Each stage below fed the next, and every design decision traces back to something a customer said.
65 customer interviews
We interviewed customers across six distinct segments — independent workshops, distributors, commercial vehicle oils, retail, franchise workshops, and mining and industrial — plus Castrol subject matter experts. Nine interviews with independent workshops across NSW, QLD, ACT, VIC and NZ; seven with distributors across VIC, NSW, QLD, TAS, WA and NT.
Every interview was structured to capture the same eight things, so the output could be compared segment to segment rather than read as anecdote.
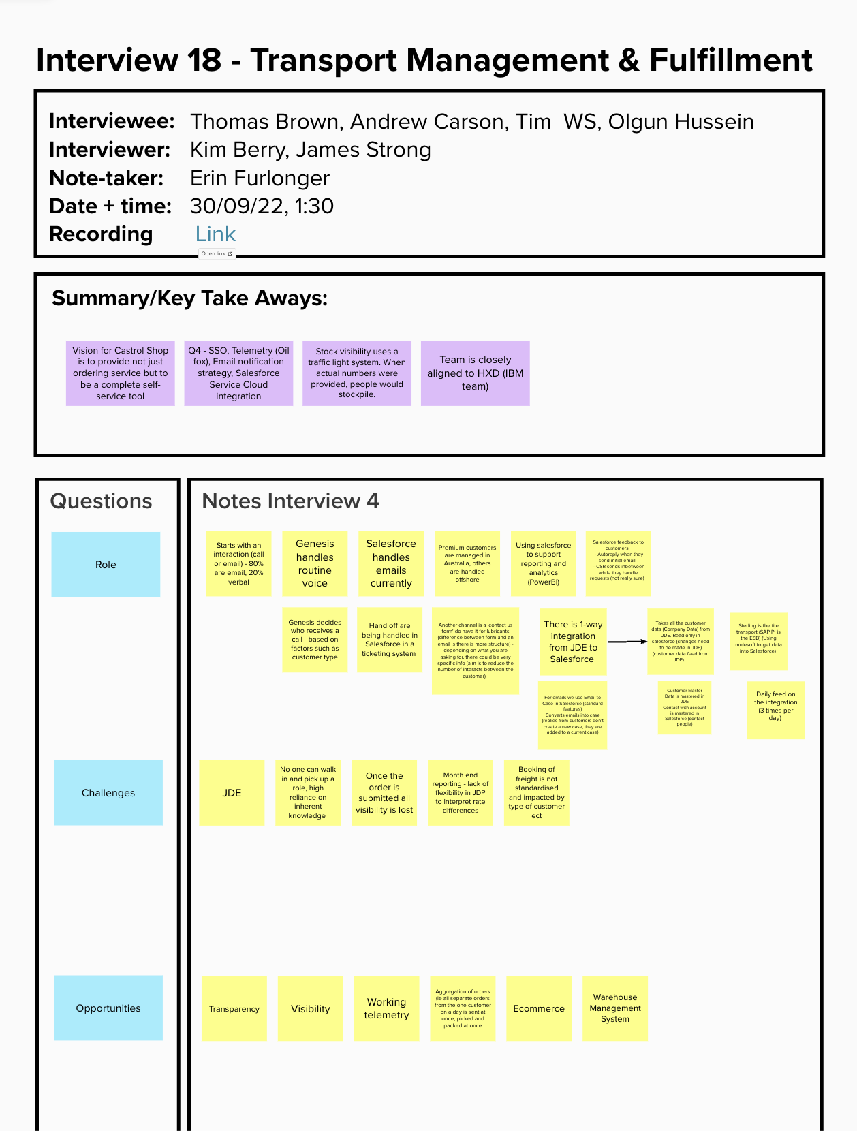
One interview, coded: every note tagged to a moment, a feeling, a pain point or an opportunity so it could be rolled up across all 65 sessions.
Personas
We built detailed profiles of the roles inside the Castrol ecosystem — workshop managers, mechanics, depot and fleet staff, distributors, and Castrol's own sales and customer service people. Each has different responsibilities, different tools and a different definition of a good day.
Holding all of them at once mattered: the mechanic who needs the right oil for a vehicle is not the person who signs off the order, and neither of them is the person who chases the delivery. The tool had to serve all three without becoming three tools.
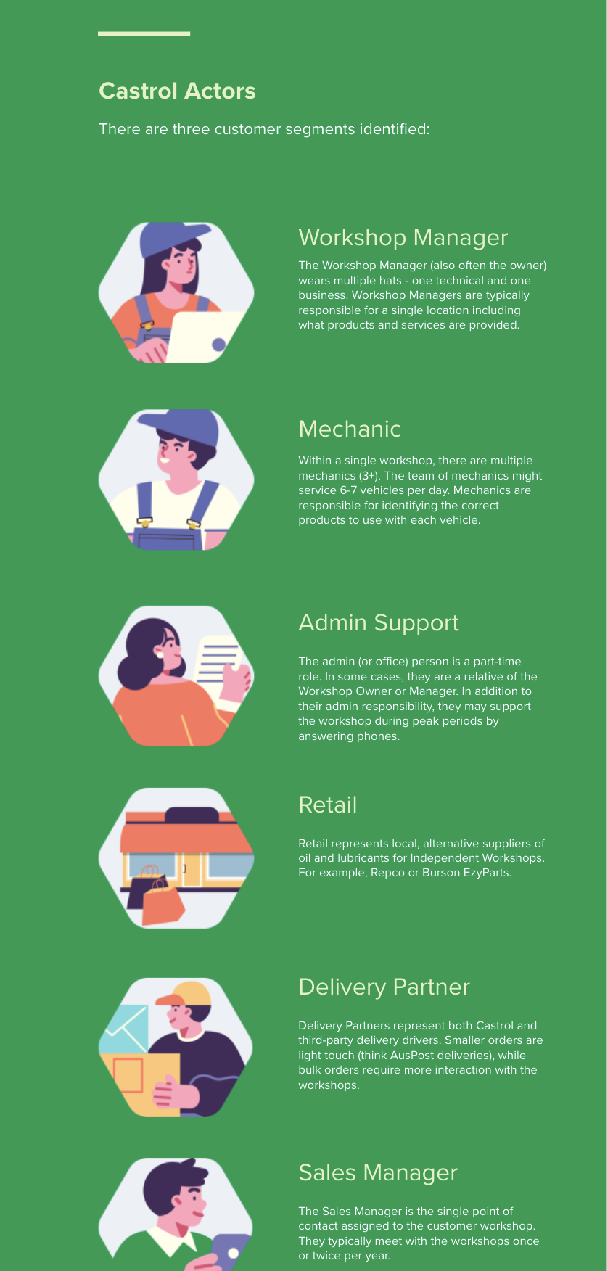
The persona set, role by role — jobs to be done, tools used and frustrations.
As-is user journeys
Six journey maps, built from the interview data and Castrol SME input, laid out the 'moments that matter' — the routine and on-demand interactions, the emotions, the verbatims, the pain points and the supporting data.
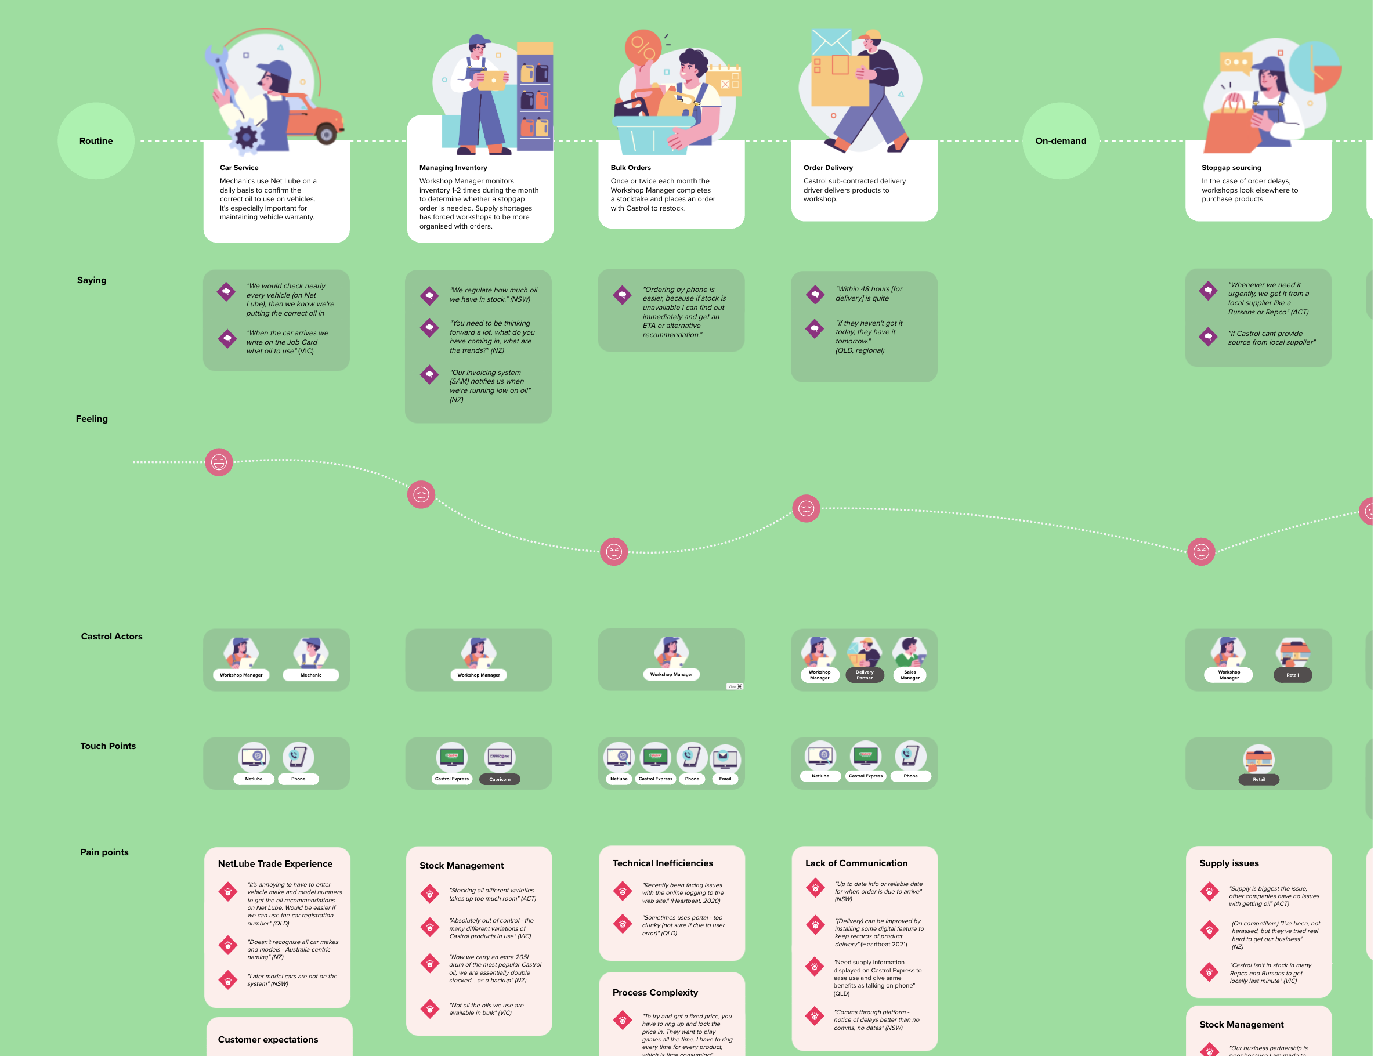
The independent workshop journey, end to end — scroll sideways to follow the day.
Opportunity mapping
Every pain point was turned into a 'How might we' question, then scored so we could prioritise. Tap a pain point to see the opportunity it became.
To-be service blueprint
With stakeholders we built a future-state blueprint for 2030: an insights-led, digitally driven Castrol. It named the capabilities, support services and backstage processes that would have to exist for the customer experience we wanted — and it gave the programme one shared picture to argue about.
Its centrepiece was Castrol Concierge: an intelligent layer that recognises a customer, synchronises their data from the core ERP and connected services, and orchestrates proactive support rather than waiting for a phone call. Ash from ACME registers with a business email address, picks the tasks they usually perform, and their world is already there.
"ERP is important — whatever system is devised, it will need to be fully integrated."
Direct customer, QLD — prototype session, Nov 2022
Workflows, then sketches
From the blueprint we wrote user workflows — the exact sequence of actions a person takes to get a job done in the tool. They were the cheapest place to find the awkward steps, and they became the team's shared reference before any UI existed.
Then quick-fire sketching: intensive collaborative sessions generating a wide spread of interface ideas fast, so we could converge on the few worth prototyping.
In the rush to produce solutions you can stop understanding the user's needs, and design something that solves nothing.
I handled it by pinning persona insights and interview verbatims into the session itself, at the start and throughout, so every sketch had to answer to a real pain point.
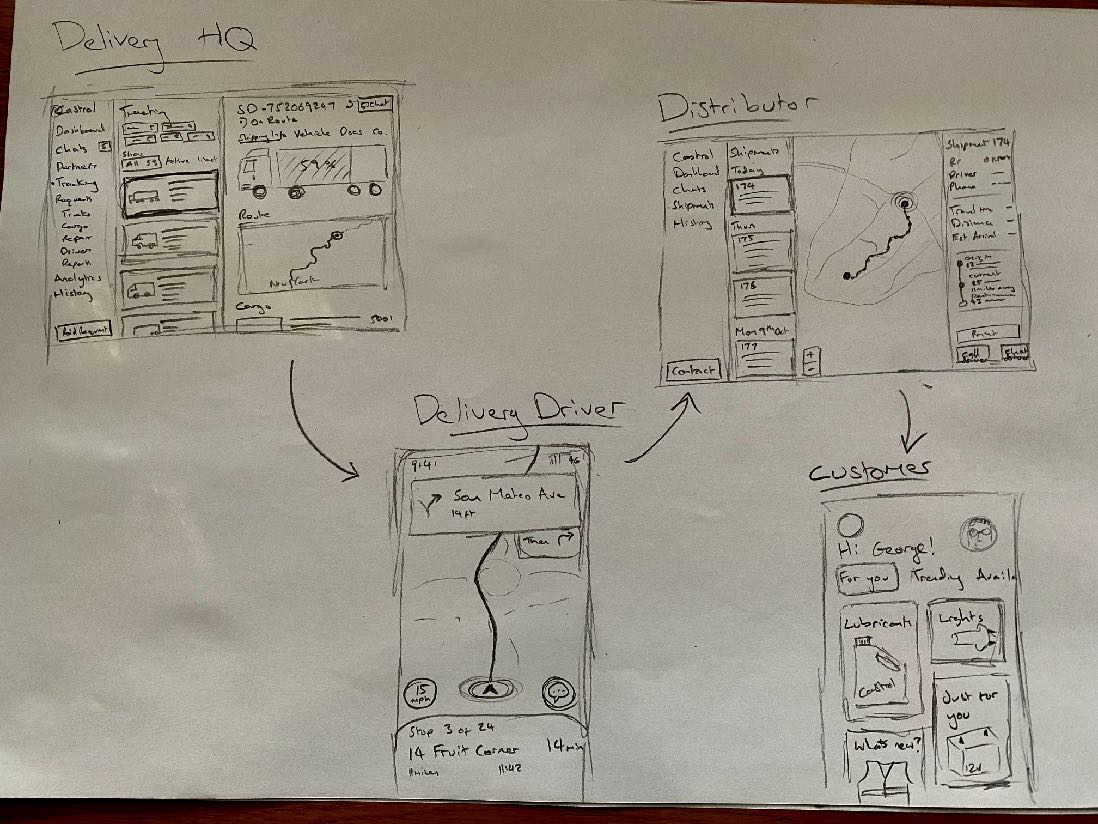
Sketching the order list, the order detail and the tracking view as one connected flow.
Designing the solution
Two views of the same truth. Customers get their orders with live status and an ETA; Castrol staff get every truck, its location and its status. Both read from the same data, which is the whole point.
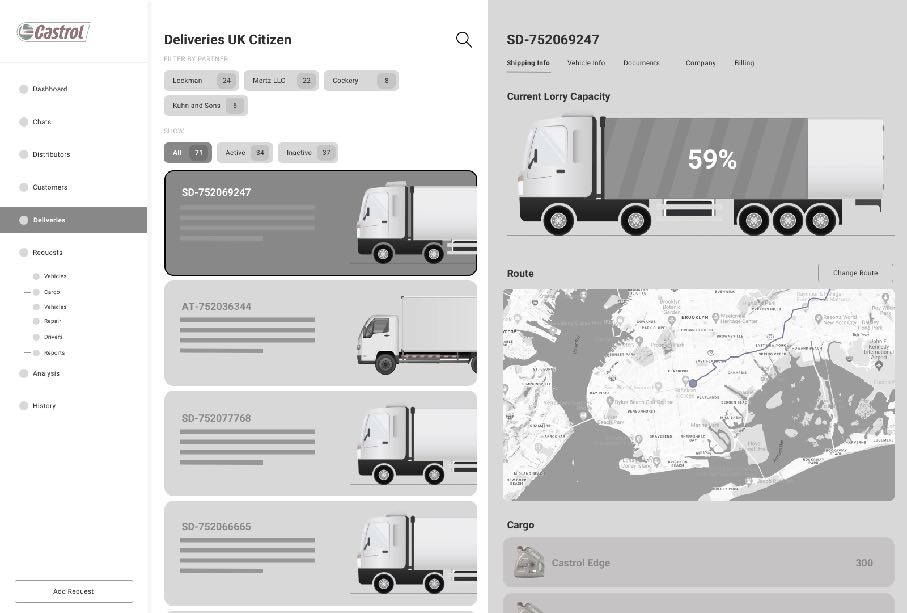
Wireframes: tank levels and a predictive order trigger on the left, live vehicle tracking and delivery status on the right.
Prototypes & user testing
The concepts went into interactive prototypes and straight into customers' hands — remote sessions with distributors, workshops and depot staff across ANZ through November 2022. We watched them try to place an order, chase a delivery and check a tank, and fixed what they tripped on.
Two rounds of this loop settled the arguments we couldn't settle in a workshop: how much detail belonged on the order list, whether predictive ordering felt helpful or presumptuous, and how much trust a live ETA had to earn before people stopped phoning.
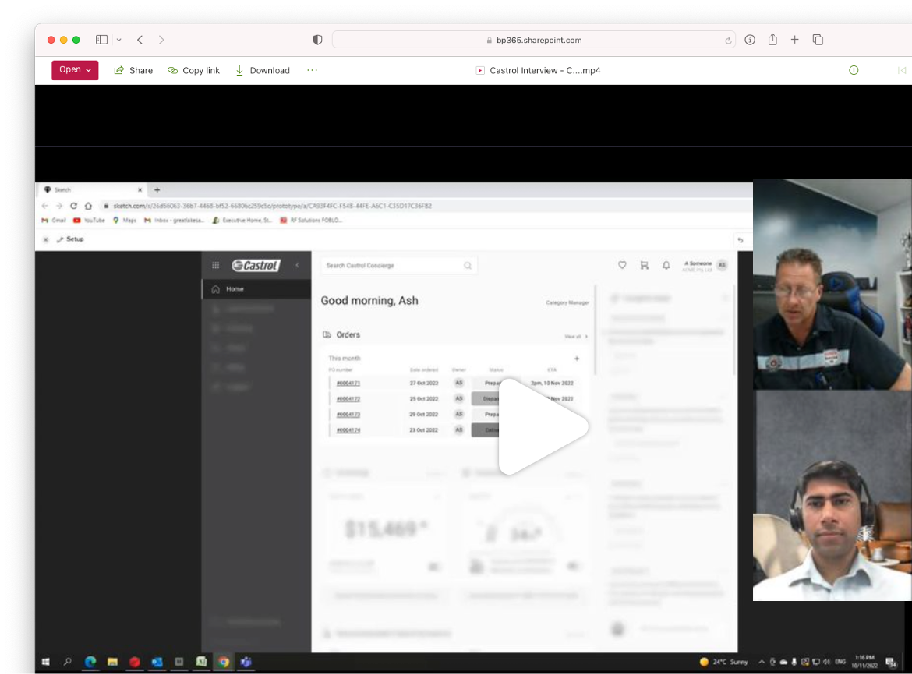
Remote moderated session: prototype shared on the left, participants reacting on the right.
UI design & design library
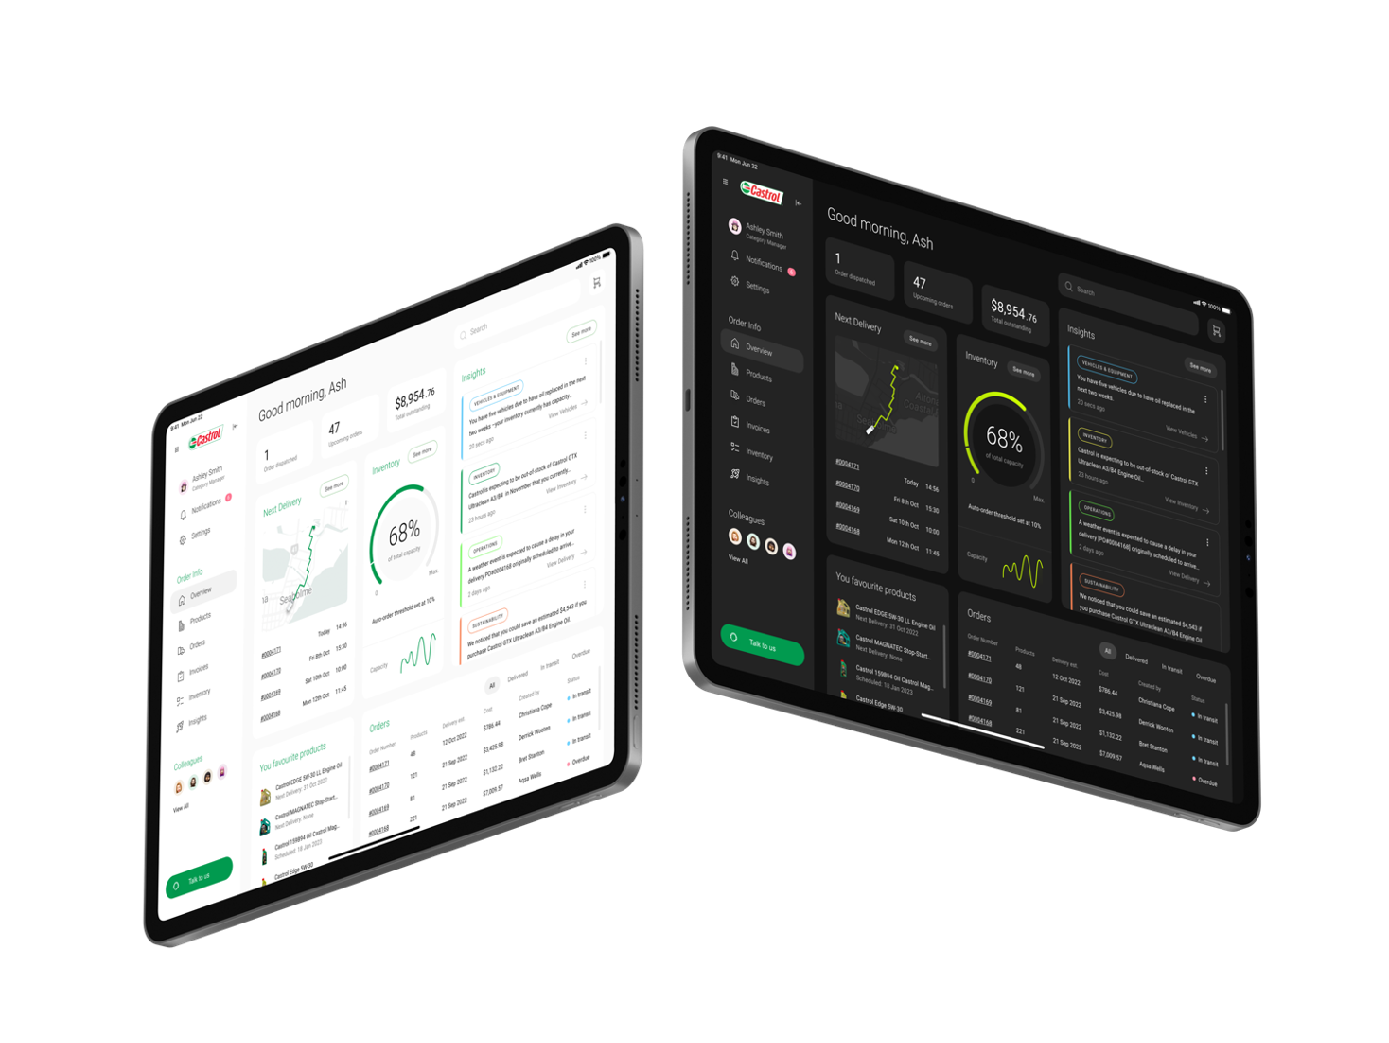
The final interface carries Castrol's brand into a dense operational tool: dark data surfaces for monitoring, light surfaces for reading and ordering, and one component library so the web app and the mobile tracking view stay the same product.
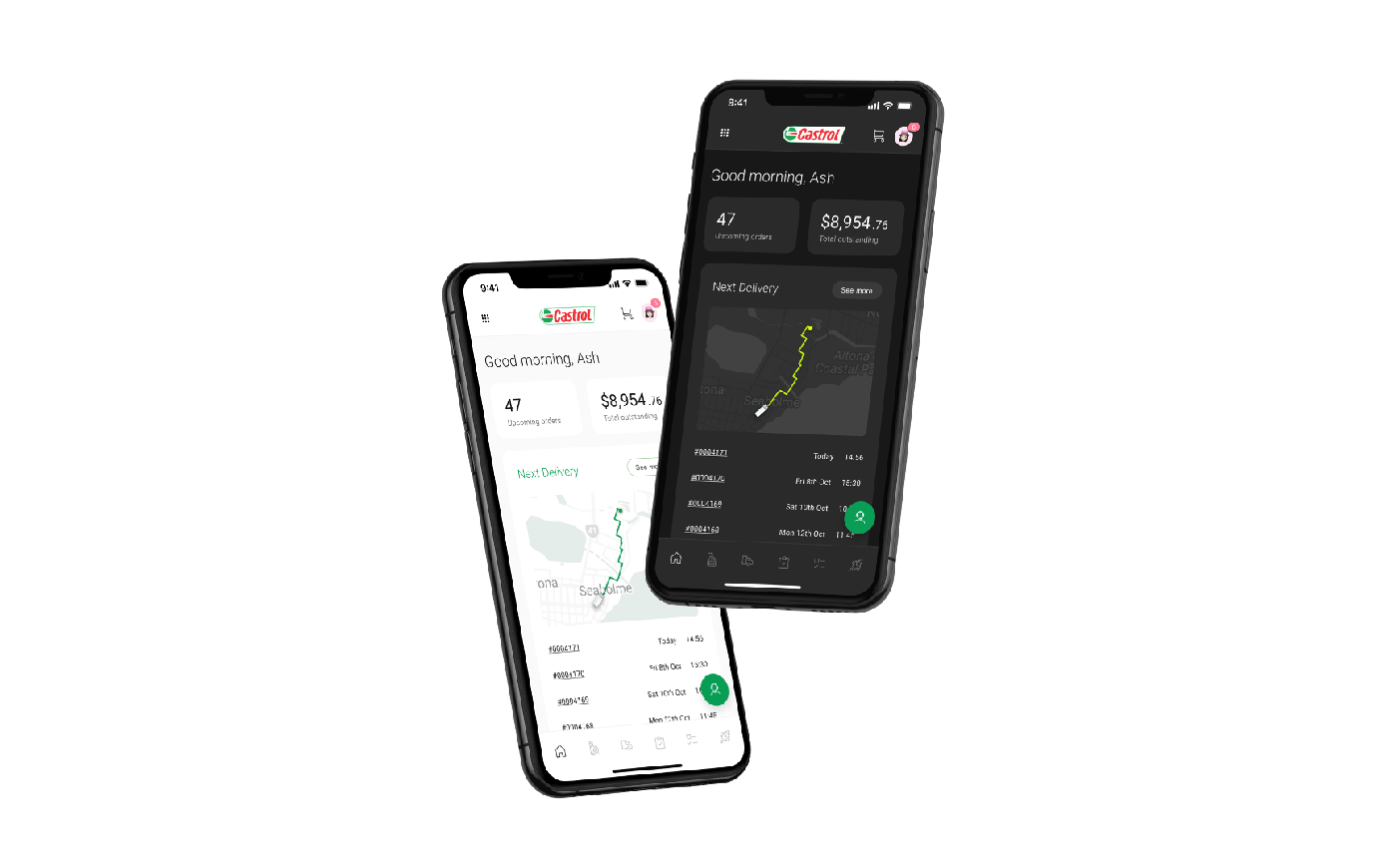
Desktop and tablet for the people running the account; mobile for the person standing next to the tank.
The promo film
To take the product to customers and to the wider business, we cut a short film showing the tool in use — the order list, the live tracking, the tank levels — in the language of the depot rather than the language of a design review.
It also did a quieter job internally: it gave stakeholders who had only seen flat screens a way to feel the experience end to end, which made the case for the next phase of build considerably easier to make.
The product film. Watch on YouTube →
What it changed
The research became the reference document for the ANZ programme: 65 interviews, six journeys and a master customer journey that other teams still work from. The delivery management tool turned a phone call into a screen, and a guess into an ETA.
This was a long service-design programme, and the 2030 blueprint sets the direction for the work that follows. What shipped first was the visibility — orders, status, tracking and documents in one place — because that was the pain customers named most often.